
Ever wonder if simple numbers can hint at the next big NFT trend? Blockchain data, which is like a digital ledger that tracks every transaction, gives us a clear view of what's happening in the market. By keeping an eye on things like daily trades and active wallets, you can spot hints of changes before they hit the news.
In this post, we chat about how digging into on-chain numbers turns ordinary figures into strong signals for NFT movements. Ready to see how real-time data can lead to smarter choices in the energetic world of digital art?
Essential On-Chain Metrics for NFT Trend Forecasting
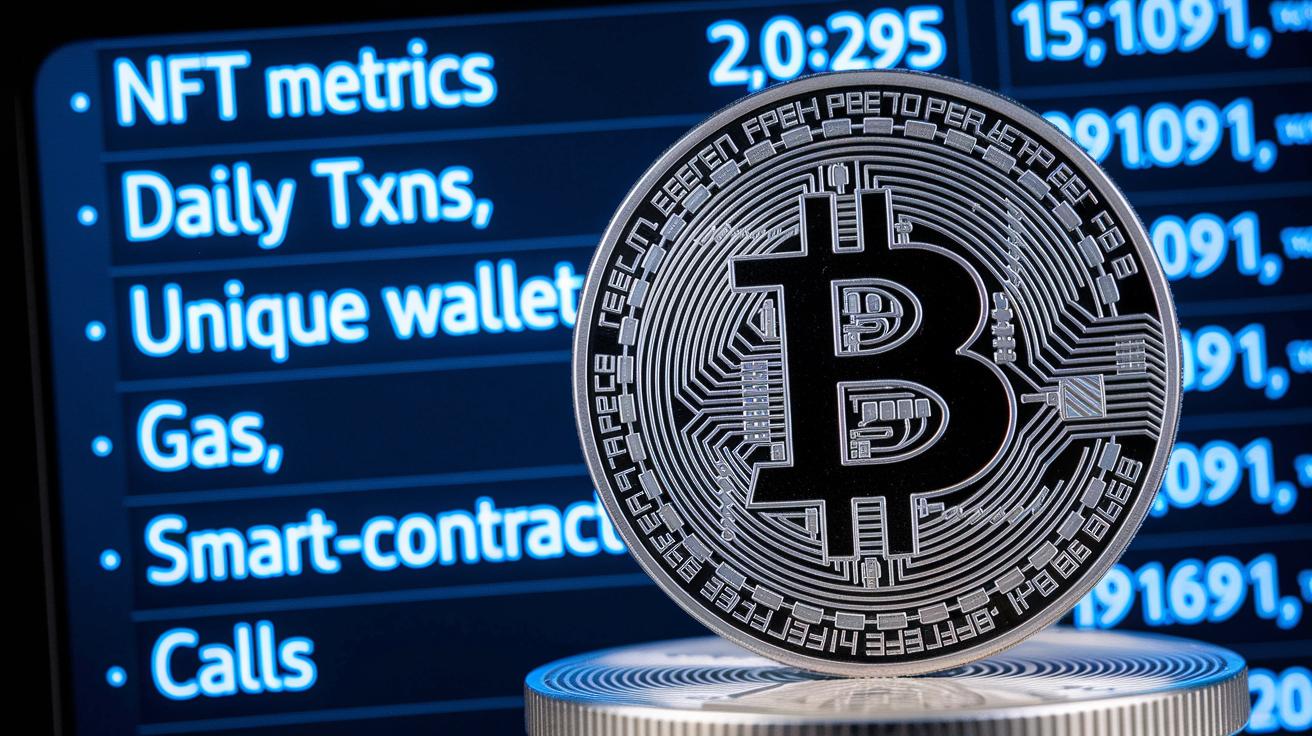
When you dive into the NFT scene, a few key numbers can really help you see what’s going on. Daily transaction volume shows how many trades happen each day, while unique active wallets count how many different users are trading. Gas usage tells us the effort needed to process these actions on platforms like Ethereum, and smart-contract calls reveal how people are interacting with automated systems. All this data comes straight from the blockchain through nodes and APIs, so it’s real-time and reliable.
Changes in these measurements can signal shifts in the market. For example, a sudden spike in daily transactions or a rise in unique active wallets might be an early sign that interest in NFTs is growing, even before prices jump. I remember a time when a 25% overnight increase in active wallets hinted at a big price rally on the horizon. Major moments like digital artworks selling for millions or NFT trading volumes shooting up in 2021 were often preceded by noticeable bumps in gas usage and smart-contract calls.
There are also smart tools available, like Nansen’s mobile AI agent and multi-chain portfolio trackers, that turn these raw numbers into clear, actionable insights. Over 100,000 investors use these platforms to keep an eye on real-time blockchain data, helping them to build forecasts for NFT price movements and changes in demand. By tracking these core metrics, traders can quickly spot opportunities and adjust their strategies, making on-chain data a powerful ally in the world of digital collectibles.
Extracting Blockchain Data for NFT Market Analysis

We start by pulling blockchain data using direct node and API access to networks such as Ethereum and Solana. In simple terms, service providers like Alchemy and Infura let us see live transaction records and smart contract activity. Companies then use AI and machine learning to sift through huge on-chain datasets. For example, from mid-2017 to early 2021, over 500,000 users traded around 4.7 million NFTs. Imagine tapping into thousands of live transactions as if you were watching a busy digital marketplace. This raw data is what we lean on to predict trends and spot sales patterns. But gathering it takes careful checks to make sure every piece is reliable and labeled correctly.
Next, indexing services and on-chain explorers step in to polish the data. Platforms such as The Graph and Covalent organize the raw blockchain info into clear, easy-to-read formats. Simple tools like Etherscan and Solscan give detailed looks at past transactions and contract events. Custom systems, like those from Nansen, mix data from different chains to highlight major trade changes. Think of it as sorting through a huge pile of puzzle pieces until the full picture of market activity shows up. By combining direct node access with smart indexing, we build a strong foundation for looking at historical data and predicting market trends in the NFT space.
Visualizing On-Chain Blockchain Data for NFT Trends: Thriving

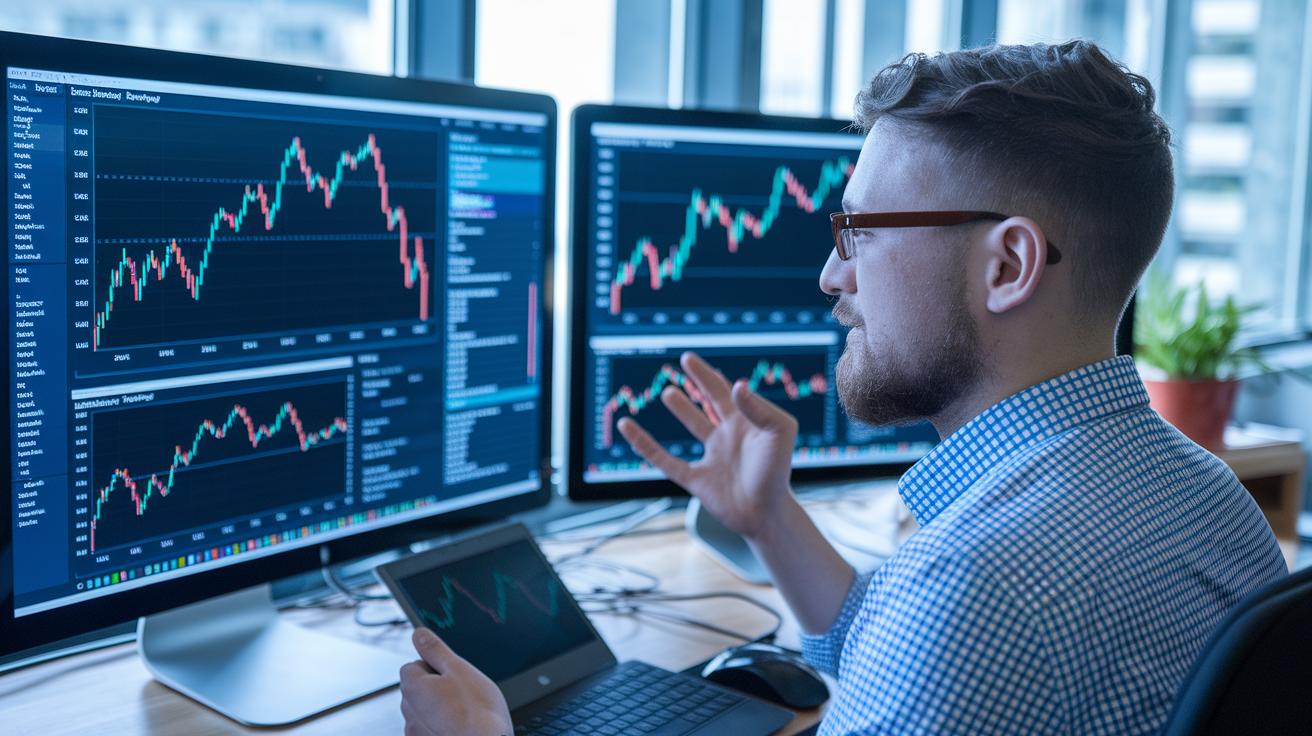
Tools like Dune Analytics, Nansen notebooks, and Tableau really make a difference by turning raw blockchain transactions into clear, interactive visuals. They take all that complex ledger data and lay it out in simple charts and graphs, so you can spot market shifts as they happen, almost like watching the market's heartbeat.
Time-series charts, heat maps, and network graphs are great for spotting when NFT activity is heating up. For example, time-series charts track numbers over minutes or days to show trend changes, while heat maps quickly reveal when wallet activity or transactions spike. And network graphs help you see how different digital assets and users connect. Picture a heat map that suddenly lights up during a busy trading session, it's a clear sign that investor activity is on the rise.
Setting up custom alerts and visual cues is key to catching market reversals early. You can tweak your settings so that a sudden jump in transaction volume or a spike in smart-contract calls lights up your dashboard. For instance, if wallet growth jumps by more than 30% in just a few hours, you’ll see a clear signal to pause and review your trading strategy.
Case Study: Machine Learning Models Predicting NFT Prices

Researchers looked at 4.7 million NFT deals from June 2017 through April 2021. They discovered that when you mix old sales, the way an NFT looks, and how popular the trader is, you can explain nearly 70% of why NFT prices change. In simple terms, pairing past sale records with visual insights and buyer activity leads to forecasts that feel pretty spot-on. One model even showed that past deal patterns alone could explain up to half of the price swings, which can really shape how you decide to invest.
Sales History Factor
Sales history gives us a great hint about future prices. It turns out that previous sales of similar NFTs often point directly to where prices might go next. For example, there was a case where a 25% jump in earlier sales volume came right before a big market upswing. This factor alone can explain up to 50% of price changes. Keeping an eye on these trends helps investors read the mood of the market and be ready for upcoming shifts.
Visual Features Factor
The study also found that looking at visual details with computer-vision techniques makes predictions even better, boosting accuracy by 10% to 20%. By breaking down features like color patterns and design details, the model can gauge how much buyers care about the look of an NFT. In one striking example, an NFT with unique visual traits improved prediction accuracy by nearly 15%. This makes the visual angle a powerful tool in forecasting market trends.
Trader Popularity Factor
Trader popularity rounds out the picture by adding roughly another 10% boost to prediction performance. Active and well-known traders often set the pace in the market, and their frequent transactions help signal new trends. Using this information, the model sharpens its forecasts, making it easier for investors to spot promising opportunities based on market behavior.
| Factor | Variability Explained | Performance Impact |
|---|---|---|
| Sales History | up to 50% | baseline |
| Visual Features | 10–20% | + accuracy |
| Trader Popularity | 10% | + accuracy |
Identifying NFT Market Drivers and Risk Factors via Blockchain Data
When you look at NFT markets, big sales events, media buzz, and celebrity shoutouts really grab investor attention. Eye-catching auctions and record-breaking digital art sales have pushed trading volumes to new heights, with millions of dollars moving around. Data shows that when the media is all over a story and influential figures chip in, unique wallet activity and trade counts can climb by about 30 to 40 percent. This jump in token activity is a clear sign that market feelings are shifting, giving us a peek into the ups and downs of the digital collectible world. It really helps investors and regulators decide on their next moves.
On the flip side, there are warning signs too. Analytics often spot unusual fund flows and odd transaction patterns that might hint at scams. Advanced blockchain tools even run impact checks on crypto events and token volumes to catch sudden data spikes or lapses in quality. Real-time dashboards and alert systems work hard to flag computing issues and security risks before they blow up. Some platforms link to detailed risk studies to show how these signals can help prevent fraud and liquidations. This hands-on, data-driven approach lets users tweak their strategies pretty fast, keeping their digital collectibles investments safer in these wild, unpredictable markets.
Step-by-Step Guide to Interpreting On-Chain NFT Metrics
Forecasting NFT trends gets simpler when you break the process into easy, manageable steps. By focusing on key on-chain numbers like unique addresses, how fast transactions move, smart contract actions, and wallet balance changes, you can spot early signals of changing trends.
-
Collect raw on-chain data via APIs or explorers.
Start by gathering live info directly from the blockchain using tools like APIs or blockchain explorers. Think of it like picking fresh ingredients before you start cooking, each data point you grab helps complete the overall picture. -
Clean and normalize transaction histories.
Next, sift through your data to remove any clutter. It’s similar to tidying up a messy room so that you only keep what really matters, leaving you with clear and accurate transaction histories. -
Visualize key metrics.
Turn your numbers into simple charts or graphs. Imagine sketching a picture that highlights volume spikes or growth in wallet activity, these visuals can quickly show you where the action is happening. -
Engineer predictive features.
Boost your analysis by creating indicators such as recent sales or gas usage stats. For example, a sudden jump in gas fees might hint at more trading on the way. This step builds signals that help predict upcoming trends. -
Train a simple model to connect features with price movements.
Now, set up a basic model to learn from your data patterns. It’s like testing a new recipe to find the perfect balance, this model helps you see how changes in these metrics relate to price shifts. -
Interpret the model outputs and refine your settings.
Finally, review what your model is telling you and adjust its parameters as market conditions change. Think of it as fine-tuning your instruments to get the most accurate readings possible.
Final Words
In the action of dissecting NFT trends, we covered the core on-chain metrics like transaction volume, active wallets, and smart-contract interactions. We looked at how blockchain data guides us through data extraction and visualization, while a case study showed machine learning's role in predicting NFT prices. We also highlighted market drivers and risk factors, along with a clear six-step guide for interpreting data. Relying on blockchain data to predict nft trends, investors gain clearer insights and a positive outlook on smart digital asset strategies.
FAQ
- Using blockchain data to predict NFT trends (PDF, 2021, 2022)
- The discussion shows how on-chain metrics like transaction volume, wallet activity, and smart-contract calls help forecast NFT trends. The documents from 2021 and 2022 explain these forecasting methods clearly.
<dt>Is NFT worthless now?</dt>
<dd>
  NFTs still hold value based on scarcity, proven sales records, and active market interest, even amid market shifts.
</dd>

<dt>Can AI predict crypto prices?</dt>
<dd>
  The use of AI in predicting crypto prices relies on analyzing blockchain data and historical trends. These models spot market shifts, though they cannot guarantee precise price predictions every time.
</dd>

<dt>How is NFT related to blockchain?</dt>
<dd>
  The relation between NFTs and blockchain is established by the use of decentralized record keeping. Blockchain technology verifies ownership and unique attributes of NFTs through smart contracts.
</dd>

<dt>Is NFT still relevant in 2025?</dt>
<dd>
  The ongoing relevance of NFTs into 2025 is supported by continued investor interest, evolving on-chain metrics, and market trends that highlight the dynamic nature of their value.
</dd>

