
Ever wonder if NFT trading charts might actually hold clues to boost your trading game? NFT trading pattern analysis uses price changes and sales data to map out market trends. Traders rely on simple tools and key numbers to spot shifts that could mean big changes are coming. By mixing past data with today’s market buzz, they can pick up on patterns that suggest what might happen next. In short, this approach helps investors tweak their strategies and grab smart opportunities in the fast-moving world of digital assets.
Foundations of NFT Trading Pattern Analysis

NFT trading pattern analysis looks at common ups and downs in prices and sales for digital items like video clips, GIFs, trading cards, and in-game supplies. Traders use both technical tools, like moving averages and chart shapes, and basic details such as an artist's reputation, how rare an asset is, and token rules (ERC-721 or ERC-1155, which set the standard for digital tokens). They pay close attention to numbers like the lowest price an asset reaches, total sales volumes, the number of unique buyers, and rarity levels.
Here's a fun fact: When a lesser-known digital card starts attracting hundreds of unique buyers, it's not just a passing trend, it could signal a bigger change in the market mood.
By keeping an eye on these details, traders can tell when the market is heating up or cooling down. They mix past data with today's market chatter to understand digital collectibles better. For example, charts might show a steady climb followed by a quick dip, hinting that it might be time to be careful. On the other hand, if you see sales steadily going up while prices stay low, that could mean there’s a hidden gem waiting to be discovered.
Linking these on-chain numbers with the creative side of NFTs helps investors see the full picture. Comparing trading moves to rarity levels gives a clearer idea of overall market health. When traders spot these trends, they can fine-tune their plans and balance risks, turning detailed pattern analysis into a smart way to catch promising trading opportunities.
nft trading pattern analysis: Bold Market Trends
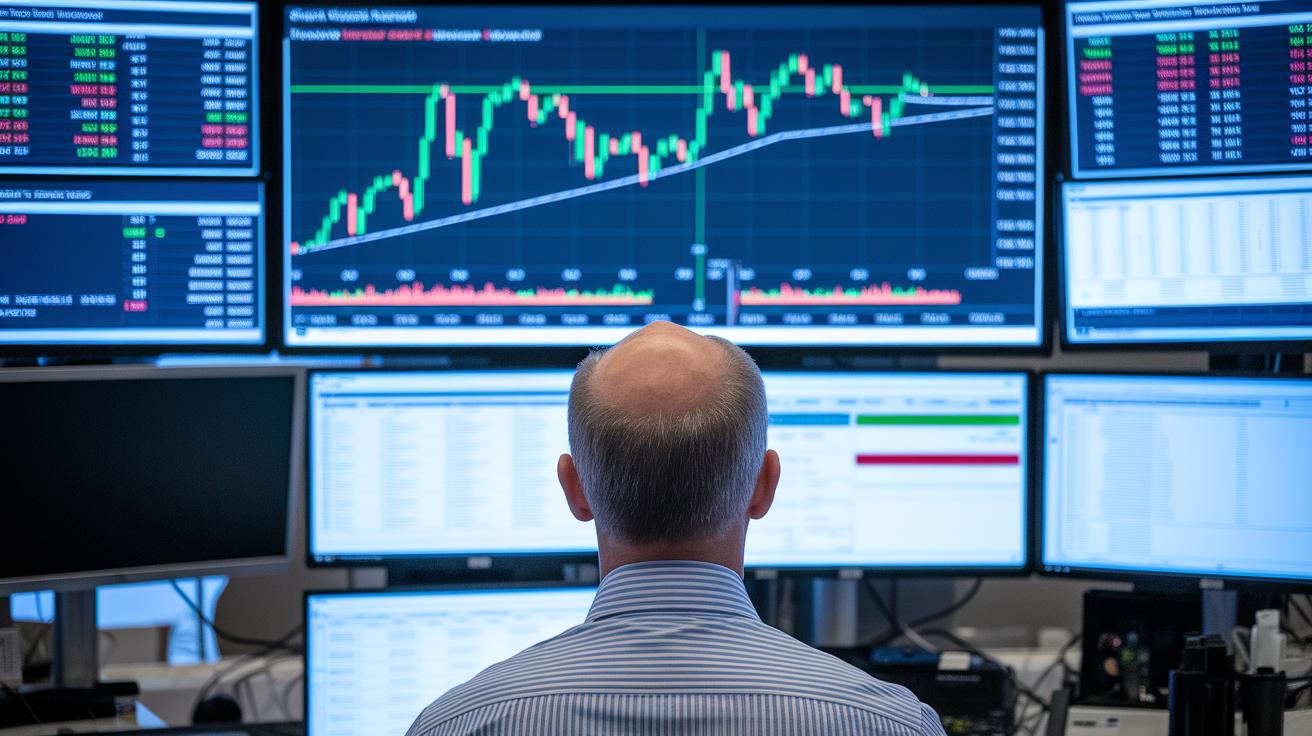
When you check out NFT charts, you see much more than simple numbers. They reveal clear patterns in price and sales volume that point to where the market might be headed. Traders often compare floor prices over time and look for well-known shapes, like head-and-shoulders, triangles, and double tops. For example, noticing a head-and-shoulders pattern can be a hint that the market might flip, much like you might pack an umbrella when dark clouds appear.
A favorite trick traders use is the moving average. By laying down the 50-day or 200-day moving averages, the wild ups and downs get smoothed out. It’s like drawing a neat line over a bumpy road, showing you where the speed bumps are along the journey of price movements.
Tools such as RSI and MACD also come into play when checking out NFT sales. These indicators help show if a token might be too high or too low in price. For instance, when the RSI climbs high, it might mean the asset needs a breather, just like a sprinter who runs out of steam. With these tools and classic chart patterns, as explained in resources like technical analysis chart patterns, traders can even set up alarms for any big shifts in the market.
In short, reading these charts is like putting together a puzzle. Every indicator you add makes the whole picture clearer. By comparing price swings with sales data and using several technical markers together, traders can not only see the current market vibe but also spot potential reversals and upward moves. All of this helps build a strong plan for making smarter trading choices.
On-Chain Data Mining for NFT Trading Pattern Detection
When we talk about on-chain data mining, we're referring to the process of digging into blockchain records to pick up early hints of trading trends. By watching smart contract activities, like minting (creating new digital items) and transfers, we can see when digital collectibles are being gathered or spread around. For example, a sudden burst of minting events might show that investors are gearing up for a big upcoming interest spike. This method gives traders a real, upfront look at market moves that you can't spot just by glancing at trends.
Another important part of this process is keeping an eye on wallet movements. Big players, sometimes known as whales, can trigger huge market moves when they shift large amounts of assets. By tracking these major moves, traders can catch early signs that market feelings may be shifting. Many crypto analysis tools offer dashboards that sort trade flows by token, time, and wallet type. This helps separate everyday transactions from the big moves that might mark the start of a trend change. Looking at this ledger data also reveals recurring trading cycles, which can be a good guide on when to buy or sell. All in all, these insights give a practical edge, helping you understand the market's pulse in real time.
Identifying Volume Spikes and Volatility Surge Signals in NFT Trades

When you see a sudden jump in sales or a rush of new buyers, it's often a sign that NFT prices might change quickly. Think about those big launch days for popular collections, sales can spike, hinting that prices might flip soon. That’s your cue to watch the volume and price closely.
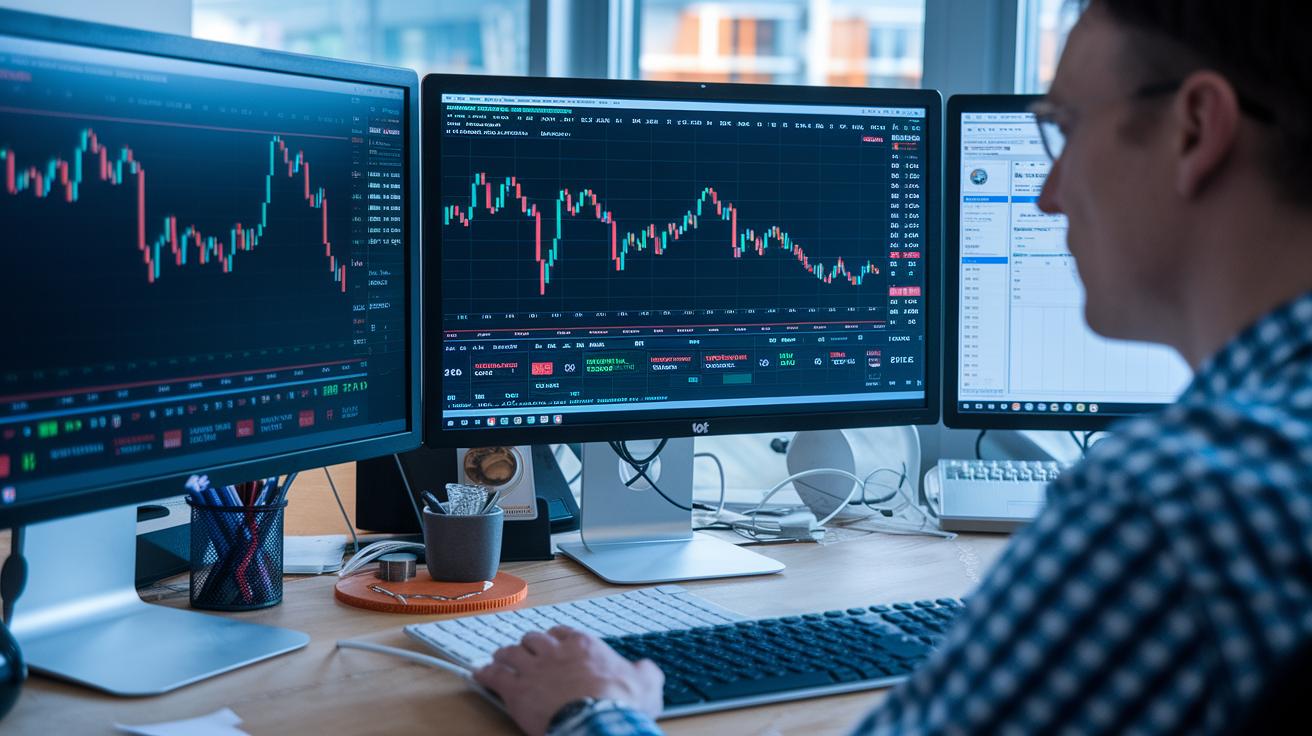
One key indicator is the overall sales volume. A steep rise here can be an early sign that the market is heating up and might push the floor price higher. At the same time, pay attention to volatility. For example, a 30% jump or drop in floor price in one day is a strong warning signal. It tells you the situation is risky but could also bring strong profits if handled wisely.
Other things to keep an eye on include spikes in the number of sales, which might show new waves of interest; sudden changes in unique buyer counts, suggesting fresh faces coming into the market; and big intraday swings in price that hint at either FOMO-driven selling or a rally that's running out of steam.
You can even set up a simple alert system by creating threshold values for these signals. When sales or unique buyer numbers hit a preset level, it can nudge you to consider entering or exiting your trade. This hands-on approach helps you catch risky moves early while spotting opportunities amid the market’s ups and downs.
Algorithmic Trading Strategies and Automation for NFT Patterns

More and more traders are turning to computer-based trading strategies to understand NFT price trends automatically. Think of a bot that watches for a floor price to cross a 20-day average and then quickly decides whether to buy or sell, it’s like having a reliable helper keeping an eye on the market around the clock.
Creating this kind of system takes careful planning and smart design. Traders often use simple AI models that scan social media for the latest buzz, turning those signals into clear triggers for trades. You can even run backtests using historical data to tweak your entry and stop-loss points, much like setting a timer for that important task so you never miss the right moment.
Adding smart contract triggers makes the whole system even sharper, as these digital rules let you execute orders instantly when the conditions are just right. It’s like having your own digital rulebook that automatically responds to market changes. Many traders tweak their systems until everything runs smoothly, no matter how the market shifts. If you’re interested in building a system like this, you might find detailed advice on crypto trading strategies very helpful. In the end, mixing these smart systems with human insight lets you catch emerging NFT trends quickly while still staying cautious in a fast-moving market.
NFT Trading Pattern Case Studies: Historical Trends and Successes

CryptoPunks shows how buying early can really pay off. In 2019, savvy traders picked up these unique digital pieces at super low prices. As more collectors realized how rare they were, those early investments grew by thousands of percent by 2021. Imagine a collector who gradually added a few CryptoPunks to their portfolio and then watched their value soar almost overnight.
NBA Top Shot is another eye-opening example. During seasonal drops, trading volumes suddenly spiked, revealing a sharp change in what buyers wanted. With fewer packs available at these events, many investors set aside a fixed amount of money at regular intervals. They bought more when the price fell and less when it went up, capturing value over time. This smart approach allowed traders to take advantage of key moments when the market hinted at big profits.
There are also great flip stories that highlight clever trading strategies. Some traders joined pre-sales and teamed up with limited-edition artists to grab NFTs before they hit the mainstream. This early move often sparked short-term momentum that led to quick profits. These cases remind us that knowing historical trends, rarity factors, and investor habits can really help shape wise NFT trading decisions.
Crypto Analytics Dashboards and NFT Market Behavior Visualization
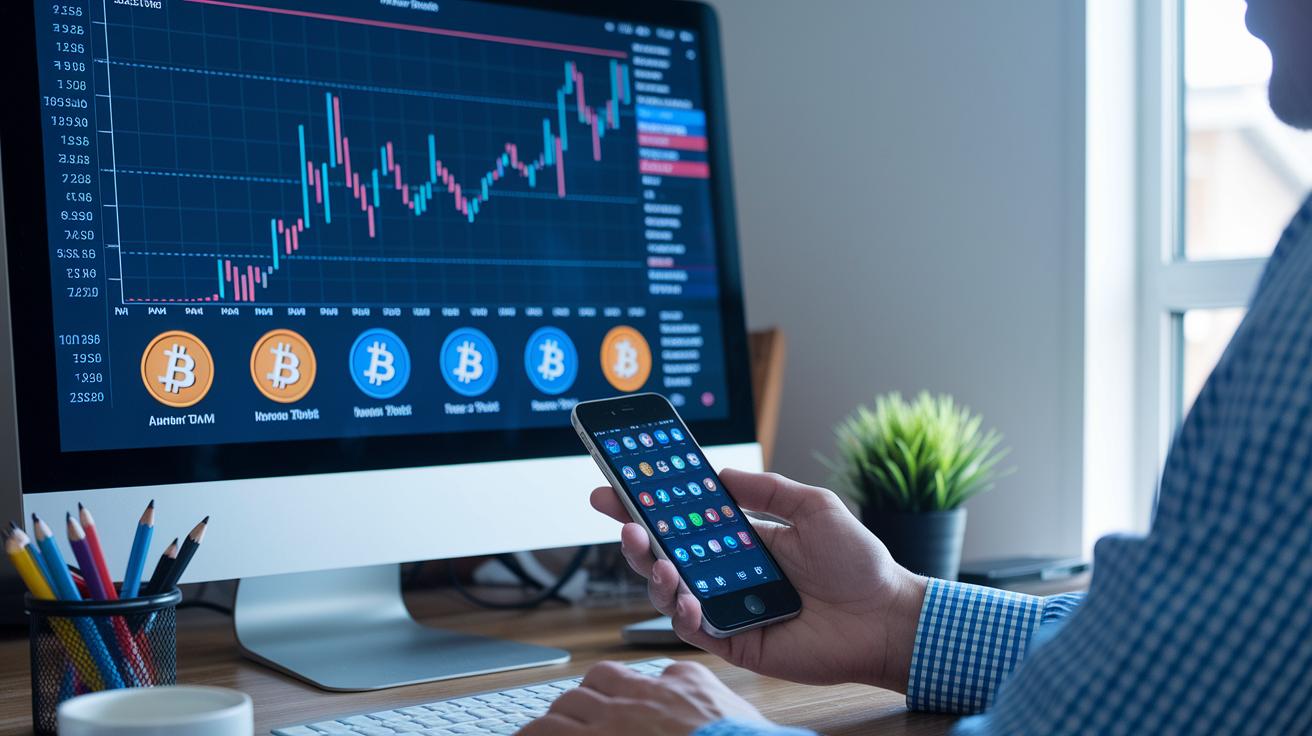
Crypto analytics dashboards are like a window into the market, giving you a clear view of trends with easy-to-read visuals. For instance, platforms like Dune let you create custom charts using SQL. These charts break down data into things like floor price heatmaps and details about trader groups, so you can see where prices pile up and how different investors act.
Another cool tool is OpenSea Analytics, which tracks the 24-hour average price and counts unique buyers. This info helps you get a sense of daily market shifts and how interested buyers are. When you mix these raw numbers with visual mood charts that use social media buzz and sales volume, it’s like checking the weather for market sentiment. A bump in social chatter along with rising sales might be a hint to dive deeper into a potential rally.
Many traders even build their own dashboards that combine volume stats with mood indicators to get quick alerts on market moves. This setup makes it easier to spot short-term changes and tweak your strategy on the fly. For more ideas on mixing these tools, check out crypto technical analysis at NFTWorthIt. In short, having these dashboards means you’re always in the loop and ready to catch emerging trends.
Predictive Modeling and Risk Management for NFT Trading Patterns

We use time-series forecasting methods like ARIMA and LSTM to get a feel for NFT floor price trends by looking at past sales. Think of ARIMA as a tool that helps spot when prices might start to climb or drop, kind of like noticing when a clock suddenly speeds up. These techniques clear up the confusion in an ever-changing market.
Market cycle segmentation is another useful way to manage risk. By breaking the market into phases – accumulation, markup, distribution, and markdown – we know how much to invest at different times. It's like following a recipe where each step calls for the right mix of ingredients. This clear-cut phase identification helps us decide when to adjust our positions or use stop-loss orders.
Risk factor evaluation also plays a big role. By spreading investments across various collections and setting fixed stop-loss orders (usually between 5% and 10%), traders create a safety net against sudden market swings. This approach helps protect capital when prices jump around unexpectedly.
Understanding price action is equally important. It lets traders see the natural flow of the market and decide the best times to enter or exit positions. By building risk models based on these observations, investors can predict price moves and safeguard their money during market shifts. In short, this strategy turns market uncertainty into smart, actionable trading decisions.
Final Words
In the action, we explored how nft trading pattern analysis can help spot key trends in digital asset markets. We broke down technical charts, on-chain data points, and volume spikes that signal market moves.
We also looked at algorithmic tactics, risk models, and real-life case studies to illustrate profitable trades. Each section aimed to arm you with tools for savvy digital investment strategies. Keep your focus sharp and your strategy dynamic, there’s always room for growth in the NFT space.
FAQ
Frequently Asked Questions
What is NFT trading pattern analysis pdf?
The NFT trading pattern analysis PDF provides a detailed guide on reading recurring price and volume movements in digital collectibles. It explains key metrics for spotting trends.
What is NFT trading pattern analysis free?
The free NFT trading pattern analysis offers basic insights on pattern detection without cost. It helps beginners understand digital asset trends through accessible data and charts.
What is the best NFT trading pattern analysis?
The best NFT trading pattern analysis uses a mix of technical chart setups and on-chain data to identify trend shifts. It emphasizes volume, floor price, and buyer counts in evaluating projects.
What does NFT strategy fun mean?
The phrase NFT strategy fun highlights engaging approaches to applying technical analysis and on-chain signals. It suggests that making sense of digital asset trends can also be enjoyable.
What is NFT strategy tokenworks?
NFT strategy tokenworks centers on combining analytical tools and market intuition to use smart contract events and price patterns for profitable digital trades.
What is OpenSea, the NFT marketplace?
OpenSea is a prominent NFT marketplace where creators buy and sell digital assets. It provides real-time data on sales volumes, unique buyers, and pricing trends.
What is Uniswap?
Uniswap is a leading decentralized exchange that supports NFT token trades using blockchain protocols. It allows for seamless digital asset swaps with automated market making.
Is NFT trading still profitable?
NFT trading remains a potential profit avenue when smart analysis and risk measures are in place. Technical insights and on-chain data help traders spot opportunities, despite market volatility.
What is the most successful chart pattern in NFT trading?
The most successful chart pattern in NFT markets often refers to replicable setups like head-and-shoulders or triangles. They signal trend reversals and guide entry and exit decisions.
How much is $1.00 NFT worth in dollars?
$1.00 in NFT terms means the same monetary value, though price may vary based on demand and asset rarity. Similar digital tokens rely on market sentiment for their worth.
Is NFT worth investing in for 2025?
The potential worth of NFTs in 2025 depends on cultural trends, market dynamics, and adoption rates. Analysts expect continued evolution, so thorough research remains essential.

