
Ever wonder if a few simple numbers could point you to the next big splash in digital art? By keeping an eye on trading volume (how often art is bought and sold), floor price (the lowest price for a piece), and average sale price, you get a sneak peek into what collectors are really feeling.
Artists used to try smaller drops before launching their best work, relying on these figures to know when to shine. Tracking these key stats can help you spot trends, make smarter choices, and cut through the confusing market buzz.
nft performance metrics: Spark Data Brilliance

Before sharing groundbreaking art pieces on digital platforms, artists often tested smaller NFT drops to gauge true market passion.
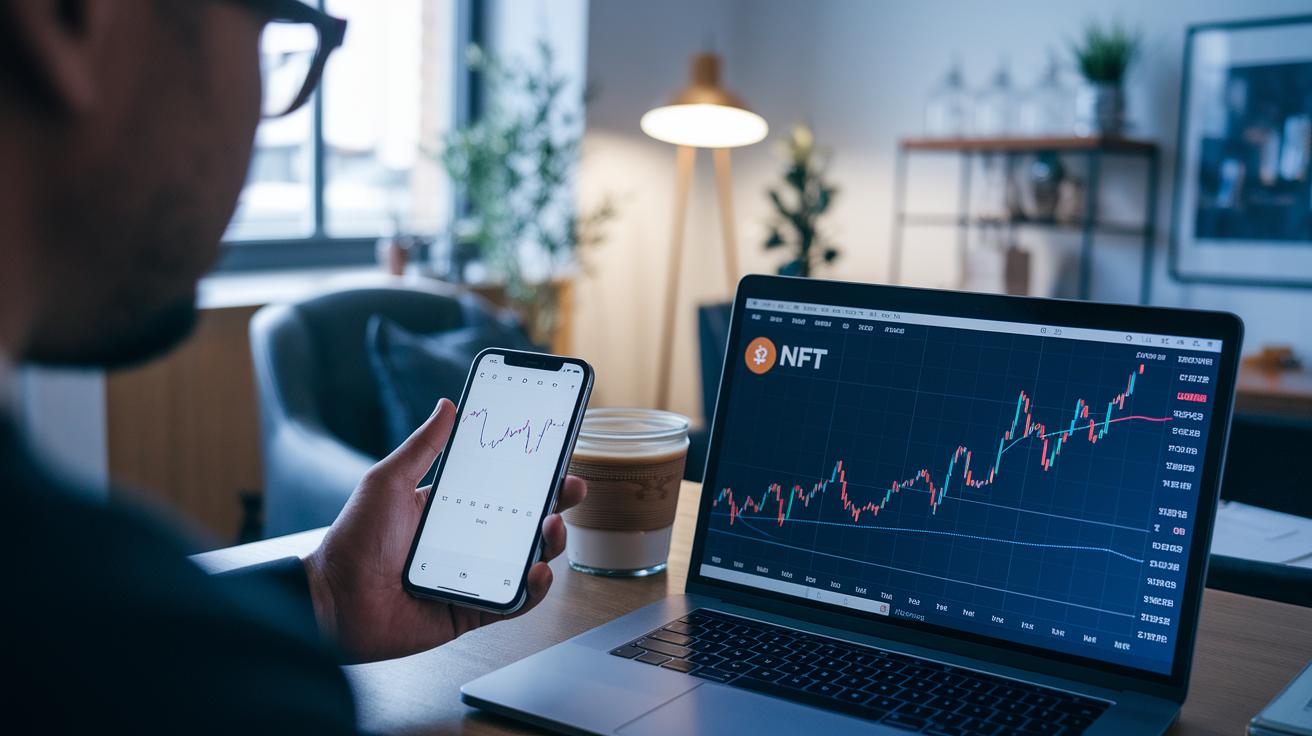
Trading volume shows us how much value is traded over a certain time, like 24 hours or a week. It adds up all the sale amounts, giving a quick peek into how active the market is. Imagine if a collection pulls in 500 ETH in one day, it's a sign that buyers are really interested.
Floor price is the lowest price listed in a collection. Think of it as the starting point for new investors. If one NFT is priced at 1 ETH while others cost more, that 1 ETH is the benchmark for the entire collection.
The average sale price comes from dividing the total trading volume by the number of sales. This number helps us understand buyer mood. For instance, if 20 NFTs sell for 200 ETH, that puts the average sale price at 10 ETH per piece.
Market capitalization is calculated by multiplying the floor price by the total number of NFTs in a collection. It gives a snapshot of a collection’s overall market value, kind of like a company’s stock market tally.
These basic NFT metrics create a solid foundation for smart investment choices. They let you compare collections, check market health, and spot good buying chances. Metrics like these empower us to make well-informed decisions in a lively market.
Monitoring nft trading volume and liquidity metrics

Tracking NFT trading activity over 24 hours, 7 days, or 30 days gives you a clear snapshot of the market's energy. It shows the total value moving in sales during those timeframes. For example, if a collection sees 150 ETH in sales over one day and 700 ETH across a week, it tells us that there’s steady interest and engagement. I often find it surprising that a single day in a buzzing collection can match the total week’s sales of a quieter one.
Liquidity ratios add another important layer by comparing daily trading activity with the collection’s overall market size. When you divide the daily volume by the market cap, you get a sense of how quickly an NFT can be traded. Often, high liquidity means there’s lots of active trading, while lower liquidity may signal steadier prices.
Other elements, like the depth of the marketplace order book and the bid-ask spreads, also shape liquidity. Platforms such as nft marketplace display these details, helping you understand the market’s flow. In short, these measures work together to point out possible buying chances or warn of risks in NFT investments.
- Trading Volume Metrics
- Liquidity Ratios
- Order-book Depth and Bid-Ask Spreads
Assessing floor price trends and price volatility in nfts
The NFT floor price is like the starting point for a collection’s value. When a listing is posted at 2 ETH while others cost more, that 2 ETH becomes the baseline. Sites like nft floor price use this number to set entry values and track price trends. For example, if you notice the floor price moving steadily from 1.5 ETH to 3 ETH over a month, it shows that buyers are getting more confident.
To figure out NFT price volatility, you need to look at how much sale prices differ from each other. Start by collecting recent sale prices, say 2, 2.5, 3, 1.8, and 2.2 ETH. First, find the average of these prices. Then, see how far each price is from that average, square those differences, add them up, and finally take the square root of the result divided by the number of sales. This calculation gives you a clear idea of how much the price jumps around.
Another useful tool is beta against the NFT market index. If beta is above 1, it means the NFT’s price shifts more sharply than the market. A beta below 1 suggests the changes are gentler. By looking at both the floor price and the volatility, investors can better understand the risks and potential rewards. It’s a smart way to figure out where the opportunities and challenges lie in the market.
Analyzing nft holder distribution and on-chain engagement
When you look at an NFT collection, counting the unique wallets holding tokens gives you a clear picture of its reach. This number tells you if the project is spreading tokens among many collectors or if a few wallets hold most of them. For instance, if you see 1,000 unique wallets, it suggests there is broad interest and a lively community.
The Gini coefficient helps you understand how evenly tokens are shared among holders. A lower value, say around 0.3, means the tokens are more equally distributed. In one case, a small drop in the Gini even hinted that a few wallets were starting to collect more tokens, which later showed up as unusual trading patterns.
Active wallet count shows how many wallets are regularly trading or doing other on-chain actions. When you mix this with charts that display transaction frequency, you get a good sense of the community’s energy and engagement.
- Total unique holders
- Gini coefficient for ownership balance
- Active wallet count
- Transaction-frequency charts
These on-chain metrics act like a health check for any NFT collection. They help spot risks like potential wash trading and give clues about long-term stability. In short, by keeping an eye on these figures, you can better understand the community and the level of investor participation.
Integrating rarity scores and composite performance indexes for nfts

Rarity scores show what makes an NFT special. A rarity engine checks how often a trait appears and ranks it. For instance, if only 1% of tokens have a unique background, that detail really boosts its score. It's a bit like finding a rare trading card in a big collection.
Composite performance indexes mix several numbers, like trading history, how active holders are, and floor price trends, into one overall figure, often called the NFT Health Score. When this score moves past a certain point, it tells investors which collections are doing well in many ways.
Investors use these combined scores to better balance risk and reward. By merging rarity scores with performance indexes, you can see whether a collection really stands out or if its progress is scattered. This makes it easier to decide where to invest, and many even link these measures to broader strategies like nft risk management.
Essentially, each unique trait earns points, and then those points are adjusted with market data to form a total score. This method lets investors track collections daily based on risk, true value, and potential returns, making the whole process data-driven and clear.
Benchmarking nft collections with quantitative investment analysis

When you use stats tools, you add solid numbers behind NFT trends. Time-series analysis, for instance, looks at data from weeks or months to show how a collection's value changes over time. Rolling returns help smooth out daily ups and downs so you can clearly see the trends. One investor put it nicely, saying, "Every day tells a story, watching daily returns over a week shows mini chapters of progress."
Regression models and correlation matrices are handy too. They let you compare different NFT collections. For example, checking an NFT's rolling returns against the ETH price might reveal if the collection moves along with the broader market. Think about it like this: "Before launching his first startup, he tracked every financial shift; his careful math transformed risk into reward."
Some key ways to analyze NFT collections include:
- Time-series analysis to chart their past performance
- Rolling returns for a glimpse of short-term trends
- Regression techniques to understand how a collection relates to overall market movements
- Correlation analysis to compare NFT price moves with ETH prices
These methods help investors see how NFTs stack up against market averages. That means you can decide whether holding on or flipping makes more sense based on real data. Tools like quantitative investment analysis make it easier to uncover clear patterns in market trends.
For example, a regression chart might show a strong link between a collection’s price changes and the overall market mood, much like a weather forecast signaling rising pressure before a storm. This detailed analysis cuts through the market noise and gives insights that shape smart holding and trading strategies.
By comparing various benchmarks and leaning on clear, numerical data, investors build a smarter picture of the risks, opportunities, and potential for growth in their NFT collections.
Final Words
In the action, we broke down key ways to measure market health, from assessing trading volume and liquidity to tracking floor price trends and on-chain engagement. We also looked at how rarity scores and composite indexes can guide your strategy for comparing collections. This clear focus on nft performance metrics helps you make smarter choices in a fast-moving market. Enjoy the process of exploring these insights and watch your digital portfolio grow strong and resilient.
FAQ
Q: What are the core NFT performance metrics for effective investment assessment?
A: The core NFT performance metrics are trading volume, floor price, average sale price, and market capitalization. They form a baseline for judging any NFT collection’s overall value and market activity.
Q: How do NFT trading volume and liquidity metrics reflect market health?
A: NFT trading volume and liquidity metrics, measured over 24-hour, 7-day, and 30-day periods, mirror market activity. They help you gauge how quickly assets can be bought or sold and indicate market stability.
Q: What do floor price trends and price volatility indicate in NFTs?
A: Floor price trends and volatility measures show the baseline valuation and price fluctuations in NFTs. They provide insights into risk levels and help you assess potential returns against shifts in market sentiment.
Q: How does NFT holder distribution and on-chain engagement impact collection sustainability?
A: NFT holder distribution and on-chain engagement, shown through unique holder counts and active wallet statistics, highlight community strength. They reflect market interest and inform decisions on the long-term viability of collections.
Q: How are rarity scores and composite performance indexes used for NFTs?
A: Rarity scores and composite performance indexes merge trait frequency with performance data to rank NFT collections. They help assess buying opportunities and balance risk when reviewing different digital assets.
Q: How can quantitative investment analysis benchmark NFT collections?
A: Quantitative investment analysis uses statistical tools like time-series analysis and correlation to ETH. Such methods compare collections against each other and market averages, supporting informed decisions on holds or flips.

