
Have you ever wondered if the NFT market is a goldmine or just a roll of the dice? In 2023, the NFTs hit an amazing $36.19 billion before taking a sharp drop.
This guide looks at key points like past sales, rarity (how hard it is to find a particular NFT), and how investors usually feel. We mix solid data with fresh ideas to help you make smarter choices.
Stick with us and see how these insights might change your strategy as the market shifts.
Core Components of an nft market analysis framework

The NFT market made quite a splash in 2023, hitting USD 36.19 billion. Experts now expect it to surge to nearly USD 521 billion by 2032. It’s been a wild ride, after peaking around USD 25 billion in 2021, it dropped to just USD 4.8 billion by 2024. These ups and downs show just how fast things can change.
To really get what’s happening, you need more than just a glance at the headlines. You’ve got to dig into the details, like rarity, demand, and where the NFT came from. By mixing old-school methods like comparing past sales with newer ways that look at future income, you can start to see the true value behind these digital assets.
- Market Sizing & Cycle Evaluation – Look back at past transaction data to spot trends. For instance, if you notice a sudden spike in digital art sales, that could be a sign the market is shifting its mood.
- Rarity & Provenance Assessment – Check out how unique an NFT is by looking at its traits and who made it. This helps build trust and shows if it might hold its value over time.
- Valuation & Pricing Techniques – Use a mix of comparing similar sales and forecasting future cash flows to find a fair price. This way you make decisions based on both the numbers and the market vibe.
- Liquidity & Volume Metrics – Keep tabs on how many NFTs are switching hands, how fast they’re sold, and what the overall trading volume is. This helps you know if you can sell your investment later on.
- Sentiment & Risk Indicators – Listen to what the community and media are saying while tracking market volatility. This gives you clues about investor confidence and potential risks.
By combining all these steps, you get a clear view of the market. It’s a mix of solid data and smart, on-the-ground analysis that can help you adjust your strategy as trends shift.
Key On-Chain Metrics and Monitoring Techniques
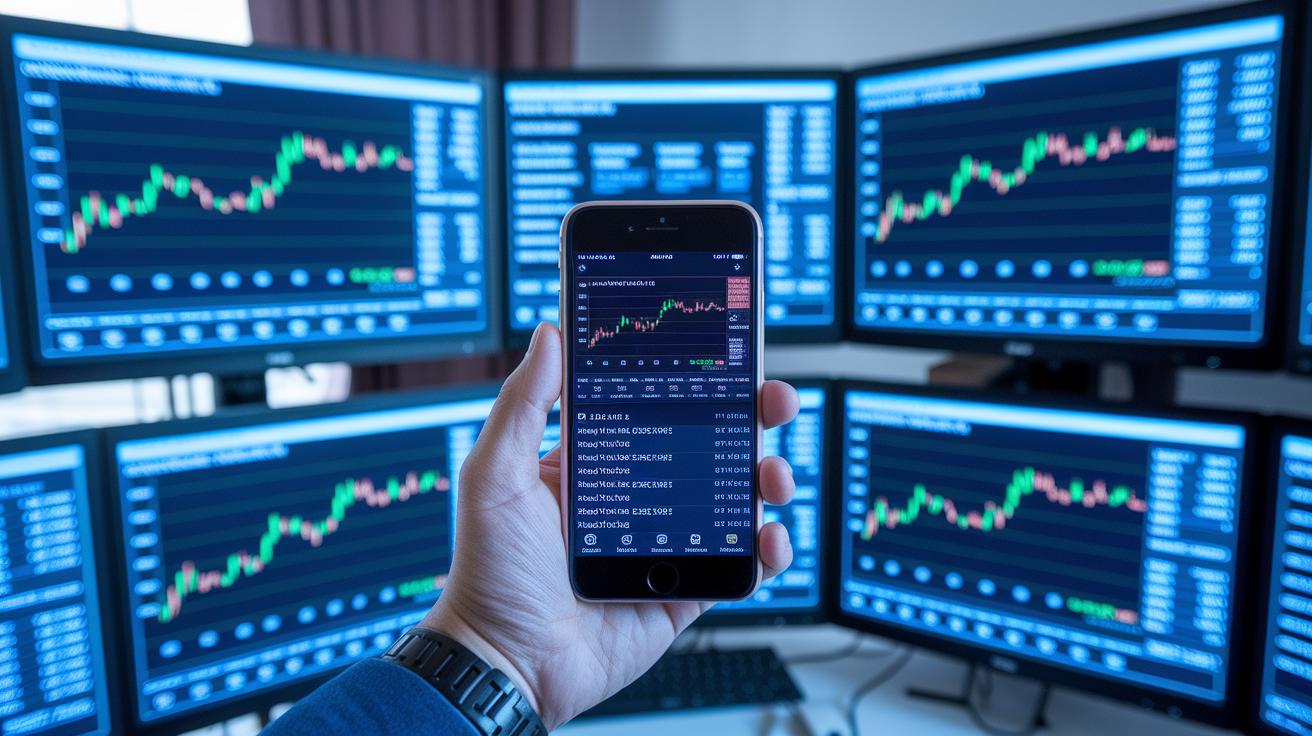
Blockchain transparency is a big help when it comes to understanding market trends. By looking at on-chain performance measures, investors get clear, real-time data that shows them how trends are shifting. This kind of openness lets you follow the heartbeat of NFT trades, which is key when digital asset collecting relies on solid numbers. For example, in 2021, NFT collectible sales hit around $8.4 billion and gaming NFTs reached about $5.2 billion. At the same time, active wallets grew from 89,000 in 2020 to 2.5 million in 2021, showing a lot of interest and profit possibilities. And with tools like Polygon and smart partnerships, tracking huge amounts of on-chain data has become much simpler, giving a real picture of investor moves.
- Total transaction volume
- Active wallet addresses
- Unique holders
- Mint counts
- Transfer counts
- Average sale price
- Sales per category
- Profit distribution by wallet
- Smart contract calls
- Network fees
Keeping an eye on these key numbers can really show you what's happening on the network and in the wider market. Overall transaction volume tells you about the market’s size, while active wallet counts highlight how many people are getting involved. Mint counts and unique holders show new asset creation and distribution, and tracking transfer counts and sale prices helps you understand liquidity and pricing trends. Monitoring sales by category can point out which segments, like collectibles or gaming NFTs, are doing well. Checking how profits are spread out among wallets gives clues about wealth concentration, and watching smart contract calls and network fees adds another layer to understanding costs and investor behavior.
To track these metrics effectively, blockchain explorers and public APIs are your best friends. They give you continuous updates and let you set alerts for important changes. This means you can keep a finger on the pulse of the market, catch shifts as they happen, and quickly adjust your strategy based on solid, real-time data.
Applying rarity scoring systems in an nft market analysis framework

Rarity metrics help you figure out an NFT’s worth by focusing on how often a trait appears and how big the edition is. They look at whether a feature is common or unique and count how many copies are floating around. The creator’s reputation also matters, adding trust and possibly boosting the asset’s value. For example, art NFT sales jumped from $20 million in 2020 to $2.57 billion in 2021, and digital collectibles grew from about $10 million to nearly $8.6 billion in the same period. Checking these details gives you a first glimpse into how special an NFT really is.
Another way to look at value is by reviewing past sales of similar NFTs to catch market trends, while income-based methods predict future cash flows to see long-term promise. Both approaches offer handy insights when you mix in rarity scores.
Trait-Based Rarity Calculations
Investors often count how many times each trait shows up, then put together a composite score that gives extra weight to the rare ones. So if a particular trait pops up in only a few pieces of a collection, it really boosts the overall rarity score.
Comparative Sales Approach
This method is all about picking similar NFTs and comparing their sale prices while keeping things like timing and platform differences in mind. Doing this helps you understand what the market feels like right now.
By mixing composite trait analysis with comparisons from the market, you build a solid valuation framework. This blend sharpens your estimate of an NFT’s real value.
Incorporating market sentiment indicators in an nft market analysis framework
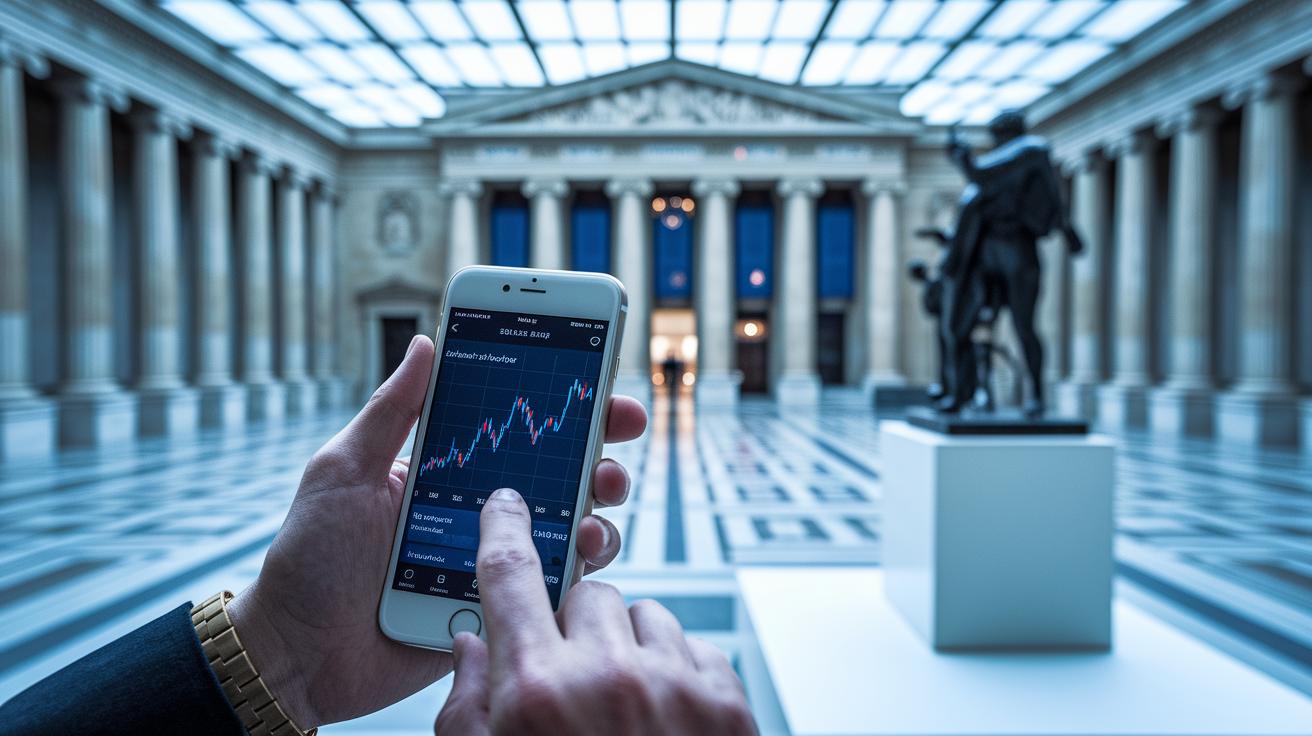
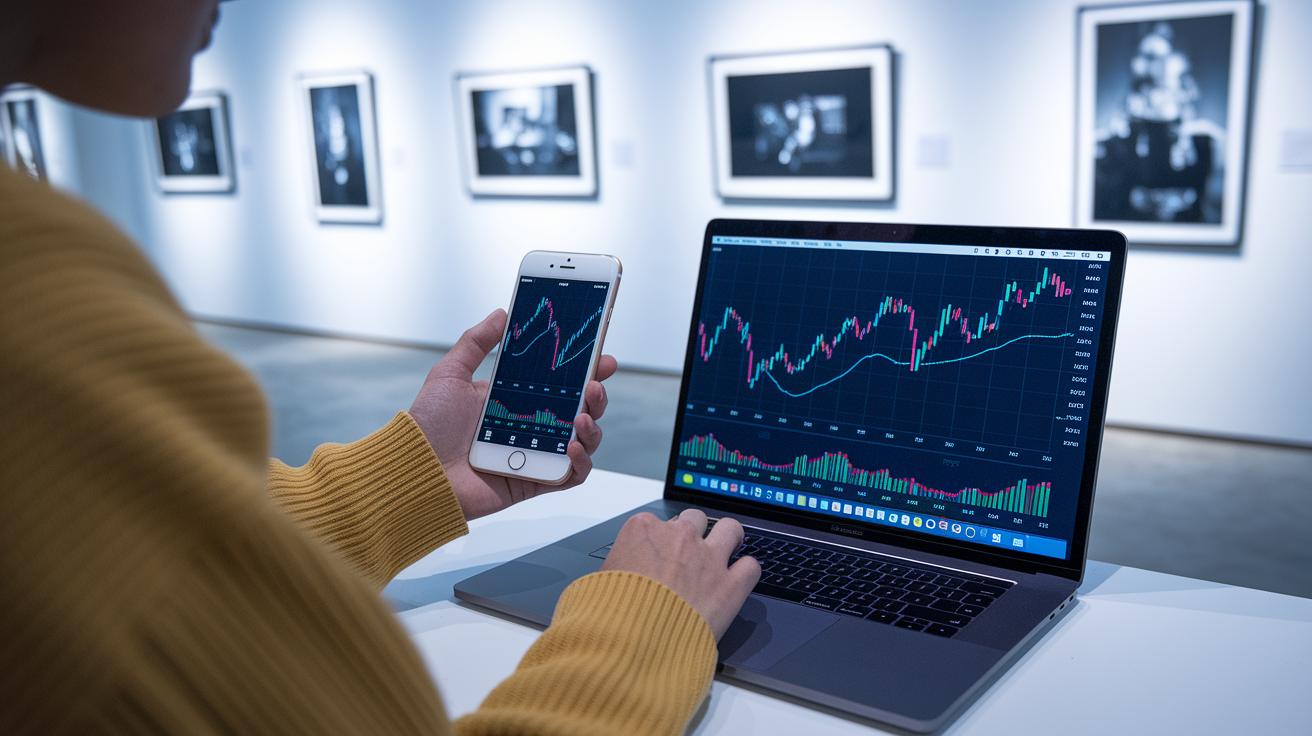
It turns out, how people feel can really drive NFT prices. When folks chat about an NFT on social media or hear it on a podcast, it sets off signals that can sway buying decisions. For instance, if museums start showcasing major collections or a well-known person mentions an NFT project, demand might jump in a heartbeat. These public conversations and the buzz within the community give you a quick look at investor and collector sentiments. In simple terms, emotions in the market matter as much as the hard data because they can spark both excitement and caution.
Here are some key sentiment indicators:
- Twitter mention volume
- Discord active users
- Podcast listener counts
- Google Trends interest score
- Major exhibition announcements
Pairing these sentiment scores with solid numbers offers a more complete picture. By blending social media trends and community engagement with actual sales figures, trading volumes, and liquidity data, you can get a balanced view. When you notice rising Twitter chatter or more active users on Discord, it could hint at upcoming price changes. But if public interest takes a dip, even when sales are steady, it might be a sign to be careful.
In a nutshell, keeping tabs on both the lively buzz of public sentiment and the hard facts helps you navigate the market with sharper insight. Isn't it interesting how market mood and numbers together help shape our investment decisions?
Evaluating liquidity and pricing volatility in nft market analysis framework

Liquidity plays a big role in keeping NFT prices steady. In a healthy market, assets can change hands fast without huge price swings. This smooth trading can draw in more investors and help the market run smoothly. For instance, OpenSea holds about 60 to 70% of the market, showing that good liquidity boosts overall confidence. With market size shrinking from USD 25 billion in 2021 to USD 4.8 billion in 2024, checking liquidity numbers is key for knowing when to jump in or pull out.
| Metric | Definition | Calculation |
|---|---|---|
| Floor Price Spread | The gap between the highest bid and the lowest ask prices | Ask minus Bid |
| Trade Depth | Total volume available at the best bid or ask levels | Sum of top orders |
| Pool TVL | The total dollar value locked in NFT pools | USD value |
To check how prices jump around, analysts use a rolling standard deviation of sale prices. In simple terms, this method averages out price movements over time to give a clearer picture of stability. This lets investors see when it might be a good idea to make a move. Keeping track of both liquidity and volatility means you can adjust your strategy as market trends and investor moods change.
Conducting cross-platform comparative studies in nft market analysis framework

Benchmarking gives you a clear picture of how different platforms operate in the ever-changing NFT world. It helps us understand market trends by comparing various approaches in a space that is pretty scattered. With big partnerships fueling innovation and efforts in North America boosting adoption, it’s important to check how competitive each platform really is. Comparing major players like OpenSea with smaller, specialized sites lets investors spot what each does best and where they might need improvement.
- Fee structures
- Active user base
- Supported blockchain networks
- Unique features (for example, auctions and royalties)
Benchmarking Example
Think of high-volume platforms like OpenSea. They typically enjoy a large community of active users, lower fees thanks to their scale, support for several blockchain networks, and standard features that draw in big amounts of trading. Meanwhile, niche marketplaces concentrate on exclusive offerings. They often feature unique auction formats, carefully selected art collections, and community-focused experiences designed for specific groups of collectors.
Balancing the hustle of high transaction volumes with the charm of specialized niches can open up new opportunities for investors, giving them access to both broad market liquidity and targeted segments that stand out.
Forecasting nft market trends with predictive modeling in your nft market analysis framework

When you’re diving into NFT markets, choosing the right model really makes a difference. You might consider regression models that review past trends or ARIMA models, which are great for handling time-based data. These tools help you catch market shifts – like when AI-driven generative art sales jumped past USD 1.2 billion, or how VR exhibitions and Layer-2 tech smooth out user experiences. With the market predicted to reach USD 521.17 billion by 2032, growing at an annual rate of 34.5%, and spanning new areas like real estate, music, and fashion, having a solid predictive model is more crucial than ever.
Here’s a simple step-by-step plan you could follow:
| Step | Description |
|---|---|
| 1 | Gather and clean your data |
| 2 | Create useful features like sentiment and volume |
| 3 | Train your model and fine-tune its settings |
| 4 | Test it using historical NFT cycles |
| 5 | Generate forecasts and explore different scenarios |
| 6 | Keep updating the model with new data |
The final step is interpreting these model outputs for your strategy. By diving into the forecasts and different scenarios, you can spot which trends have the most impact, like shifts in trading volume or changes in buyer mood. These insights let you adjust your investments and plan for what’s coming next. Plus, setting up custom dashboards in tools like Excel can help you watch market performance in real time and make quick decisions. All of this creates a feedback loop that keeps your market analysis sharp and your strategy flexible as the market evolves.
Real-life case study applying an nft market analysis framework to a top collection
A top collection like Bored Ape Yacht Club has grabbed a lot of attention. It's a great case to see how a market analysis framework works. Art NFT sales jumped from USD 20 million in 2020 to USD 2.57 billion in 2021, while collectibles grew from about USD 10 million to nearly USD 8.6 billion. And in a market where even Axie Infinity gaming NFTs hit USD 5.2 billion in 2021, this collection really stands out. CryptoPunks even made it into museum exhibits, which shows that serious collectors and big financial players are noticing.
Market Sizing & Cycle Analysis
When we look at past sales numbers, clear trends in volume and price pop out. Early results for top collections let analysts spot buying patterns. Often, a burst of growth comes before a slow-down or correction. Tracking these cycles can help predict when the next big move might happen, just like watching niche art become a hot, mainstream digital asset.
Rarity & Valuation Assessment
Figuring out a trait-based rarity score is a big deal here. Think about checking for special features like limited editions or unique artwork details and comparing them to the lowest market price. When you see a high rarity score, it usually means the collection is holding up well. That’s why collections like Bored Ape Yacht Club can ask for higher prices.
Liquidity & Volatility Tracking
One way to get a grip on the market is by looking at things like the spread between the lowest prices and how deep recent trades have been over three months. A small spread and steady trade numbers show that even during ups and downs, big collections keep trading actively. It’s a good sign that the market is stable.
Sentiment & Community Metrics
Don’t forget the power of social buzz. Watching Twitter chatter and the growth in Discord members gives important hints about how excited the community is. When more people are talking and joining, it often means the value is on the rise because collectors are both financially and emotionally invested.
All these clues show that mixing hard data with community feelings can guide smart investment decisions in top NFT collections.
nft market analysis framework: Dynamic strategy insights
When you dive into digital art and blockchain assets, it all starts with checking out the tools available. On-chain explorers, data aggregators, and custom dashboards make sense of a ton of market info. They bring you real-time numbers, past trends, and easy-to-read graphs, helping you decide when to trade. In short, understanding these tool categories can really boost your strategy when you compare prices, track transactions, and look at asset histories.
-
On-chain data:
• Etherscan – This tool shows you blockchain transactions. You can see details about token transfers and smart contract actions.
• The Graph – It’s great for quickly pulling out useful blockchain data. -
Aggregated metrics:
• Dune Analytics – With prebuilt dashboards, it collects both live and historical market data so you get a complete picture.
• Nansen – This one offers curated analytics, including tracking smart wallets and key performance numbers. -
Social and sentiment:
• CryptoSlam – It watches marketplace sales and collectibles, giving you a sense of which assets are trending.
• LunarCrush – This tool tracks social media buzz and engagement so you can see how excited the community is. -
Custom dashboards:
• Excel/Google Sheets templates – These let you create your own reports to monitor things like average sale prices and trading volumes.
By connecting these tools into one smooth reporting system, you build a framework that always stays up-to-date. Bringing together on-chain data, aggregated stats, and custom spreadsheets gives you a clear view of transaction trends, user engagement, and overall asset performance. This makes it easier to adjust your strategy as the market changes.
Final Words
In the action, we broke down the key elements of a solid nft market analysis framework. We covered market trends, valuation methods, on-chain data, rarity scoring, sentiment measurement, and risk management, all essential parts to guide smarter digital asset decisions.
This comprehensive approach shows how combining diverse metrics can lead to better insights and stronger investment strategies. Embracing these techniques can boost your confidence in the rapidly shifting NFT landscape. Happy investing!
FAQ
Q: NFT market analysis framework 2022
A: The NFT market analysis framework in 2022 uses a structured approach that examines market sizing, rarity, pricing, liquidity, and sentiment to help investors understand and navigate digital asset risks and opportunities.
Q: Best NFT market analysis framework
A: The best NFT market analysis framework combines market sizing, trend evaluation, rarity metrics, and liquidity and sentiment data to give investors a complete view of digital asset investments.
Q: NFT analysis Mir4
A: NFT analysis for Mir4 focuses on evaluating in-game digital assets through market sizing, rarity scoring, pricing techniques, liquidity measurements, and sentiment analysis to assess the tokens’ investment potential.
Q: What is NFT market size
A: NFT market size refers to the overall value and trading volume of digital assets expressed in billions of dollars, reflecting market growth trends and investor interest in the digital asset space.
Q: NFT market size 2025
A: The NFT market size in 2025 is expected to grow considerably, with forecasts suggesting a strong upward trend that highlights increased demand and ongoing market evolution despite some volatility.
Q: NFT analytics tools
A: NFT analytics tools are platforms that gather on-chain and transaction data, allowing investors to track market trends, measure liquidity, and evaluate pricing and sentiment for digital assets.
Q: NFT marketplace
A: An NFT marketplace is an online platform where digital assets are bought, sold, and traded, offering investors access to diverse tokens and data points that help in evaluating asset performance.
Q: NFT market status
A: NFT market status provides a snapshot of current digital asset trends, including market capitalization, trading activity, and investor sentiment, which informs stakeholders about overall market health.
Q: Is NFT still relevant in 2025?
A: NFTs are predicted to remain relevant in 2025 as digital assets continue to attract creative and investment interest, adapting to consumer trends and integrating more deeply with various digital ecosystems.
Q: What is the market analysis framework?
A: A market analysis framework is a structured method that combines assessments of market size, valuation, liquidity, and sentiment to deliver essential insights for active decision-making in investments.
Q: Is NFT worthless now?
A: NFTs are not worthless; their value is driven by factors like rarity, demand, and market sentiment. Even during volatile periods, carefully evaluated NFTs can retain significant investment appeal.
Q: What is NFT analysis?
A: NFT analysis is the evaluation process that reviews market size, rarity, pricing methods, liquidity, and sentiment to help investors determine potential risks and rewards associated with digital assets.

