
Ever wondered if the NFT buzz is more than just noise? When you look closer, you can see the market moving in steps, slow and steady at first, then suddenly bursting with activity. We break down these phases, showing how the market goes from gradually building momentum to those wild peaks that bring on a rush of excitement. By keeping an eye on these shifts, you can spot trends and plan your moves before the next big surge hits. In short, that burst of market energy isn’t a one-time thing. It’s a cycle that shapes the value of digital assets, and understanding it can give you a real advantage in today’s fast-moving world.
NFT Hype Cycle Analysis: Phases, Trends, and Timeline
NFT hype cycles follow a natural rhythm where digital collectibles move through clear, repeatable stages. It all starts quietly, when early buyers begin to gather assets. Slowly, this quiet activity builds momentum until the market suddenly heats up, often fueled by online chatter or FOMO. Have you ever noticed how sentiment can flip so fast that prices jump sharply in just a day or two?
Knowing these cycles is like having a map in a busy market. Whether you're watching the slow buildup during the Accumulation phase or the frenzy of activity in the Distribution phase, each stage gives hints about what investors are feeling and doing. This kind of insight helps you spot warning signs before the market shifts again.
| Phase | Duration | Sentiment | Key Drivers |
|---|---|---|---|
| Accumulation | 6–12 months | Bearish (over 70% negative sentiment) | Quiet buying, little public interest |
| Markup | Varies | Growing optimism | Institutional investments, fast price hikes |
| Distribution | 2–4 months | Euphoric speculation | Heavy retail trading, peak speculation |
| Market Reset | Short-lived | Quick corrections | Liquidating positions quickly |
These stages repeat over time. First, you have a quiet period of steady buying that eventually leads to rapid price climbs. Then comes a phase of wild speculation followed by a necessary market correction. In watching these cycles, investors can learn a lot. Seeing how each phase affects investor behavior helps you plan better, manage risks, and seize opportunities as soon as they pop up.
Mapping Adoption Timelines in NFT Hype Cycle Analysis

NFT adoption starts with a small, dedicated group and grows over time in clear stages. In the early phase, known as accumulation, early adopters quietly gather assets over 6 to 12 months before the market catches on. Soon enough, a burst of mainstream interest kicks in, fueling rapid growth as communities expand and network effects take hold.
Sometimes, viral drops turn what is usually a gradual process into a quick 2 to 4 month rush. During these bursts, hype drives fast market moves, and social media sentiments can swing from -30% to +60% within just a day or two. Investors see these sudden shifts as signs that digital collectibles are evolving far beyond early curiosity.
Timing is everything here. Each stage builds carefully on the one before, much like stacking blocks to make a tower. Understanding these timelines can help investors spot market trends and adjust their strategies, whether taking advantage of a quiet buildup or riding the wave of rapid hype.
Timeline Milestones
- CryptoPunks were minted in June 2017, sparking the first buzz around unique digital collectibles.
- Bored Ape Yacht Club launched in April 2021, drawing more media and public attention.
- A major marketplace rollout in Q2 2020 boosted trading volumes and increased user activity.
- Celebrity collaborations in late 2021 helped push mass adoption and amplify network effects in the NFT space.
Investor Sentiment Metrics in NFT Hype Cycle Analysis
In NFT markets, we keep an eye on how investors feel by using clear, number-based signals. Research tells us that about 64% of everyday NFT buyers are very sensitive to potential losses, and when FOMO kicks in, social media chatter spikes within just a day or two. By mixing up price data, overall mood, and trading volume, we get a neat snapshot of what buyers are really thinking.
Here are some of the key markers we track:
- Social media mention volume
- Sentiment-score thresholds
- Whale transaction counts
- Average holding duration
- New wallet creation spikes
- Trading volume surges
Watching these figures in real time makes understanding the market a lot easier. This approach helps both individual buyers and big market players stay on top of trends. In short, combining these mood indicators with trading data gives you a practical guide to gauge market performance and plan smart moves throughout the NFT hype cycle.
Speculative Bubble Indicators in NFT Hype Cycle Analysis
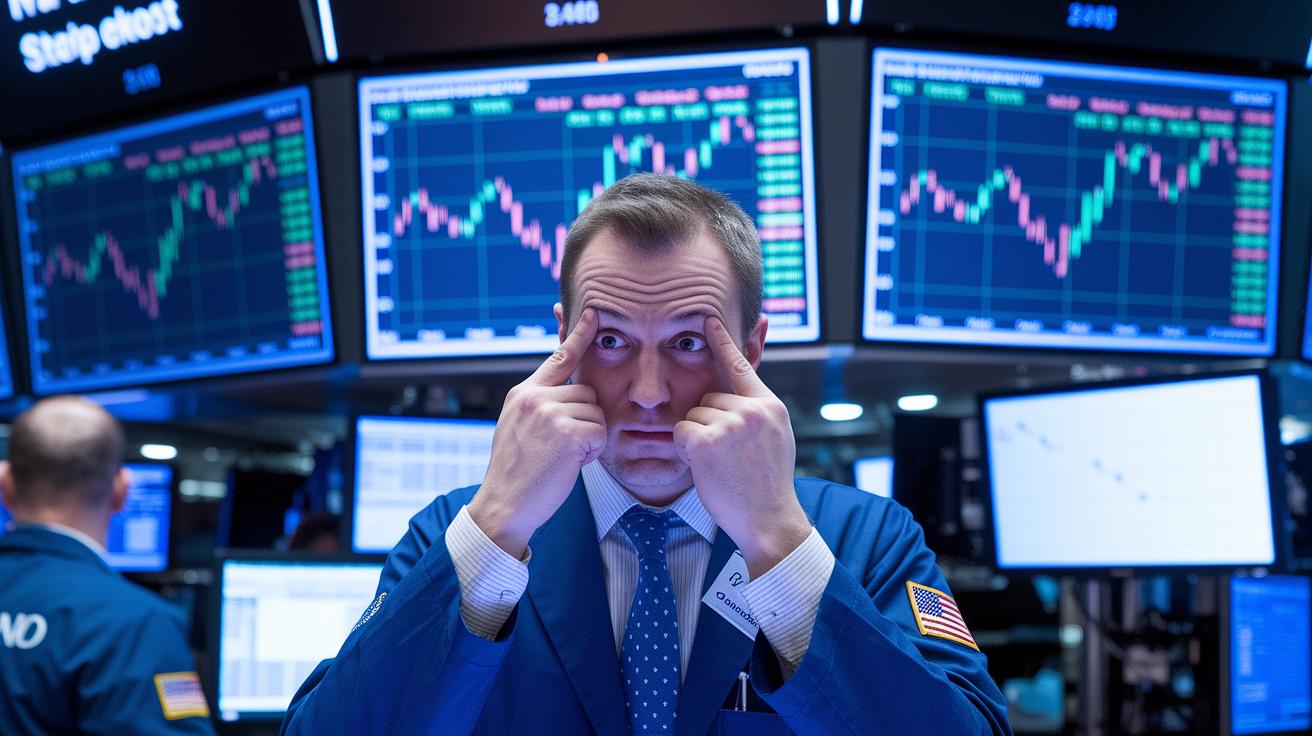
When the market heats up, you might see the price-to-floor ratio jump to more than 10 times what’s normal. This means prices are way above the real base value. It often happens when excitement and heavy borrowing mix together, pushing prices into risky territory. When things get too wild, even the savviest investors can start taking dangerous risks.
Another clear sign is when margin calls occur on leveraged positions. In simple terms, a margin call forces investors to sell quickly if prices drop, which can start a chain reaction of more sales. This quick sell-off makes prices fall even faster, showing just how unstable an overheating market can be. Noticing these patterns can help you stay alert and avoid a risky swing in the market.
Secondary Market Performance in NFT Hype Cycle Analysis
Secondary sales are a huge part of NFT trading, making up about 60–80% of all transactions. In the early stages, when excitement and speculation are high, these trades give us a sneak peek into the market's mood and hint at future value. Later on, savvy investors turn to real trading data instead of just riding the hype, showing just how quickly crypto art shifts from trend-driven buying to more careful pricing.
As the cycle moves forward, keeping an eye on floor-price stability and bid-ask spreads becomes really important. During the growth phase, you might see prices jumping around and liquidity metrics acting a bit wild. But as more people join in and focus on steady value, market watchers start looking for consistent price gaps. This steady spread is a sign that the market is moving from erratic speculation to steady, predictable growth in digital art valuation.
When the NFT market reaches its mature stage, the balance between primary and secondary sales tells us a lot about its overall health. Buyers and sellers use past trading data to set realistic price floors and understand liquidity trends. This shift moves the market away from just guessing prices to using clear, data-based strategies that help maintain long-term value.
Post-Hype Maturity & Market Correction in NFT Hype Cycle Analysis
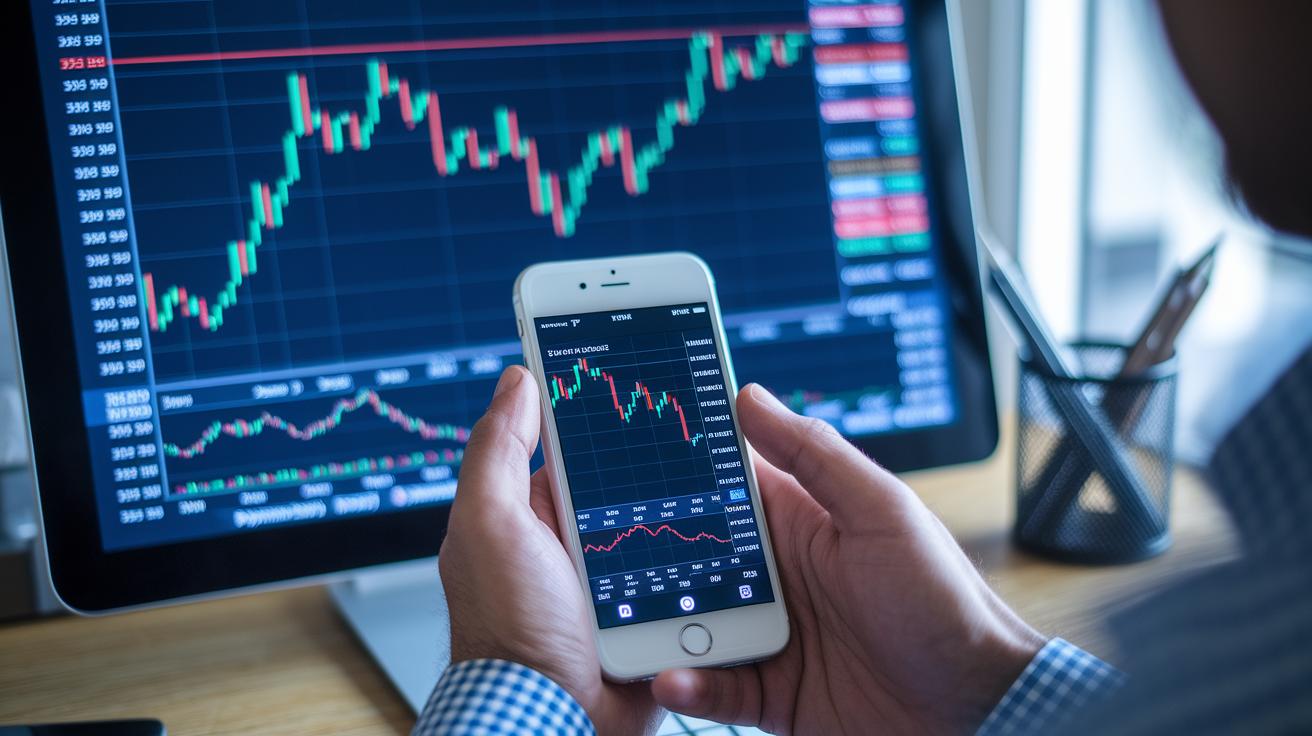
After the excitement fades, NFT markets often go through a reset. When prices drop, it’s usually because investors had to sell off assets they’d bought on borrowed money, which then sparks a broader decline. This phase typically lasts about 3 to 6 months until things start to feel more stable. In short, the big drop tells us that prices had gotten way too high compared to what the assets were actually worth.
As the wild swings calm down, early signs of a recovery start to pop up. Buying picks up gradually when the market feels less jumpy, and investors come back with clearer plans. Gradually, as both traders and collectors find their footing again, the fast price drops slow down and even out a bit. It might feel rough at first, but this reset helps clear out the excess and sets the stage for growth down the road.
Recovery Signals
One of the first hints that things might be turning around is a bounce back in trading volume. When more deals are happening even at lower prices, it means buyers are beginning to see real value.
Another signal is a tightening gap between what people are willing to pay and what they’re asking for. This narrowing spread shows that there’s more agreement on prices, boosting overall confidence.
Also, when casual chatter shifts from panic to a more balanced talk, it’s a sign that market sentiment is normalizing, and that things are ready to steady up.
Forecasting Future Trends from NFT Hype Cycle Analysis
We start with data collection. Investors check out things like pricing, transaction volumes, and even social media buzz to get a solid feel for market behavior. This steady stream of details often hints at shifts before they become mainstream.
Next, we dive into trend extrapolation. By looking back at past market cycles, experts make educated guesses about where things might head next, almost like spotting a pattern in a favorite TV show. Lessons from earlier NFT booms and resets help forecast both peaks and dips.
Benchmarking comes into play when current actions are compared against past standards. Investors match up today’s market with previous NFT phases to see if history might repeat itself. This side-by-side check keeps the hype balanced and expectations realistic.
Risk adjustment is all about staying ready for surprises. Experts tweak their predictions when new challenges pop up or when investor sentiment shifts. This way, strategies remain flexible and grounded, even when the market behaves unpredictably.
Finally, timeline setting lays out a clear schedule of forecasted events. By mapping key moments when changes are expected, investors have a handy time frame to follow. This clear timeline makes it a bit easier to adjust strategies as critical market shifts come into view.
Final Words
In the action, we covered all the key phases of the NFT cycle, from early buildup to market resets, with clear examples of sentiment shifts and speculative signals. We broke down timeline milestones and examined how secondary market moves signal evolving cycle maturity.
We also outlined forecasting techniques that help investors plan their next steps in volatile times. With thoughtful insight and a strategic approach, nft hype cycle analysis remains a valuable tool for making smart digital investment decisions.
FAQ
What does NFT hype cycle analysis 2022 reveal?
NFT hype cycle analysis 2022 reveals market phases where early accumulation, rapid price surges, and sharp corrections mirror shifts in investor sentiment and retail behavior in digital collectibles.
What does NFT hype cycle analysis 2021 indicate?
NFT hype cycle analysis 2021 indicates periods of growing attention and speculative activity, marked by phases of accumulation, markup, and eventual market reset as retail and institutional interest evolved.
What are the main phases in an NFT hype cycle?
The phases in an NFT hype cycle include accumulation, markup, distribution, and market reset, each defined by different durations, sentiment levels, and key drivers like volume surges and wary institutional moves.
How do investor sentiment metrics impact NFT markets?
Investor sentiment metrics impact NFT markets by tracking shifts in social media mentions, trading volume, and new wallet creation, which help gauge market mood and signal potential price fluctuations.
What speculative bubble indicators should investors watch in NFT hype cycle analysis?
Speculative bubble indicators include extreme price-to-floor ratios and heavy retail leverage, which serve as early signs of market overheating and potential cascading sell-offs.