Have you ever noticed how a small interest in digital art grew into something worth billions? Back in 2020, NFT values started off small and then quickly soared to billions in just a few years.
Behind every jump in trading are stories of investors switching their focus and making bold choices. In this post, we’re going to take a closer look at the numbers and trends to help you see how NFTs are shaping the future of the market.
Historical NFT Sales Trends: Core Insights and Market Behavior
The NFT world changed a lot between 2020 and 2022. Back in January 2020, the market cap was about $50 million, and between 2018 and 2020 the market nearly grew ten times. By October 2020, the market cap had leapt to $1.3 billion. It’s like curiosity turned into a big money wave almost overnight.
By 2021, NFTs were talked about everywhere. The trading activity exploded in global value, just in the third quarter of 2021, trading hit $10.7 billion, which is a huge jump compared to before. In fact, total NFT sales in 2021 soared to $24.9 billion, a big jump from the $94.9 million seen in 2020. More wallets joined the party too, with numbers shooting up, and even NFT art experienced its own burst of activity with $1.7 million in sales from August 2021 to August 2022.
| Date/Period | What Happened | |||||||||||||||||||||
|---|---|---|---|---|---|---|---|---|---|---|---|---|---|---|---|---|---|---|---|---|---|---|
| January 2020 | Market cap was around $50 million | |||||||||||||||||||||
| October 2020 | Market cap jumped to $1.3 billion | |||||||||||||||||||||
| 2018–2020 | Market grew nearly tenfold | |||||||||||||||||||||
| Q3 2021 | Trading value hit $10.7 billion | |||||||||||||||||||||
| 2021 | Total NFT sales reached $24.9 billion versus $94.9 million in 2020Volume and Transactional Data Examination in NFT Market
Peak activity numbers show just how lively the NFT scene has become. Lately, we've seen active wallets and daily sales hit record highs, and it’s a clear sign that more people are jumping into the market. This exciting surge hints at strong investor interest and a bustling ecosystem, everyone's not just buying and selling, but actively trading day by day.
Recent spikes in the numbers show that the market is buzzing with activity. High-frequency trading is boosting liquidity, and it's kind of like the early rush when a trend first catches on, mixed with the steady confidence of seasoned investors. Have you noticed how these shifts, as mentioned on NFT trading volume trends (https://nftworthit.com?p=804), are a clear sign that buyers are stepping in and helping the NFT world keep growing? Pricing Evolution Analysis and Volatility Dynamics of NFT AssetsMost NFT sales happen at affordable prices. Over half the transactions are under $200, and more than 75% are priced below $100. This shows that many collectors are drawn to tokens they can easily afford. It also means that even people who are new to investing can comfortably join in. Think of it like a busy marketplace where many low-priced items change hands, keeping a steady buzz even on busy days with 1,000 to 3,000 unique buyers. Occasionally, big auction events shake things up. When something like The Merge sells for $91.8 million or Beeple’s Everydays goes for $69 million, it grabs everyone's attention. Sales like the LeBron James NFT statue at $21.6 million or the Doge meme sale topping $4 million add a wild twist to everyday transactions. These standout events create big price swings, making the market feel vibrant and ever-changing. Demographic and Buyer Behavior Analytics in NFT Market
US data tells us that NFT buyers come from many different age groups and include both men and women. For example, about 14% of people interested in NFTs are between 18 and 24 years old, and 8% fall in the 25–34 range. When you look at those aged 18–34, roughly 24% are men and 21% are women. In other words, both genders share a similar level of interest even though the crowd is mostly young. You can check out these figures in the nft market demographics report (https://nftworthit.com?p=539), which shows how different segments of buyers behave. Income also seems to influence interest in NFTs. Interestingly, investors making less than $25,000 a year invest about the same amount in NFTs as those earning over $150,000. It seems that no matter how much you earn at the ends of the spectrum, there’s a spark for these digital assets. Mid-income groups, on the other hand, appear a bit less active. The way people engage also differs based on their collecting style. Millennials, for instance, are three times more likely to buy NFTs compared to Gen Z, and about 42% even keep physical collections. Plus, NFT interest isn’t only about collecting for some. Gaming fans are also very involved, with 20% showing high interest and 35% moderate interest. These trends paint a picture of a diverse and dynamic market where different passions and incomes bring people together. Secondary Sales Analysis and Collector Strategy Evolution in NFT MarketBetween August 2021 and August 2022, art sales on the secondary market reached an impressive total of $1.7 million. Out of that, primary art sales made up about $500K, while tokens changing hands later brought in roughly $1.28 million. This lively mix shows how active the market is, giving chances for quick flips as well as longer-term holds. Collectors are often drawn to items that are rare or have a big historical impact. For instance, CryptoPunks appear in five of the top 20 NFT sales, showing just how much scarcity matters. It’s interesting to note that around 370,000 owners now hold tokens valued at a total of $2.9 million. Even more surprising, the top 9% of these owners control 80% of this value. This concentration helps shape how investors study token transitions and plot their future resale strategies. Major drops, like The Merge at $91.8 million, Beeple’s piece at $69 million, a popular Doge meme sale topping $4 million, and a LeBron statue sold for $21.6 million, make a strong impact on the market. These standout events shift collector behavior and influence predictions for future resale values. They show how a mix of speculation and collectible charm can change the game in surprising ways. For more insights, refer to nft secondary sales analysis (https://nftworthit.com?p=755). Forecast Methodologies and Future Trend Projections for NFT Markets
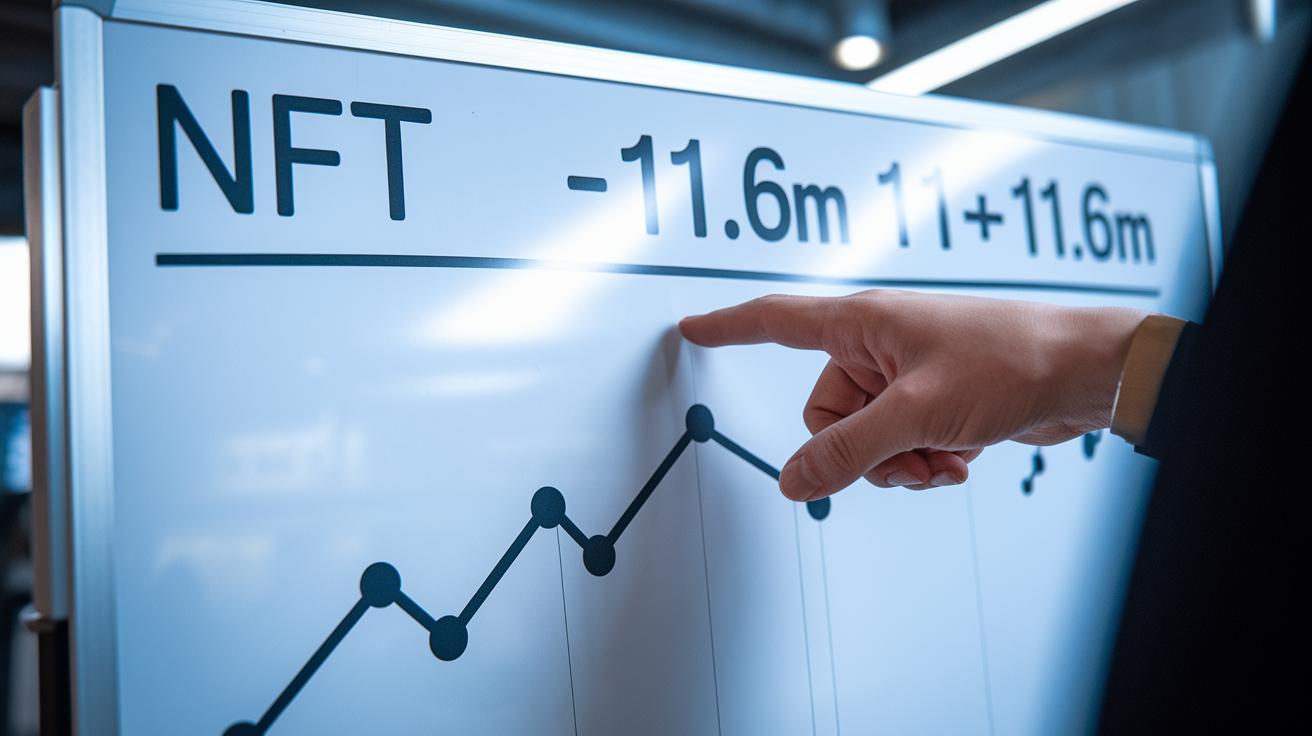
User numbers and market value trends are like a roadmap for where NFT markets might head. In 2022, around 8.73 million people joined the scene, and that number climbed to about 10.24 million in 2023. By 2025, experts expect nearly 11.64 million users. Even though the overall market value dips a bit, from $683.9 million in 2024 down to $608.6 million in 2025, global forecasts still see an impressive $49 billion valuation by the end of 2025. Plus, there will be over 100 active marketplaces, with OpenSea alone drawing 7.8 million visits in September 2025. These numbers really help us use prediction tools and methods in blockchain research. New uses for NFTs are shaking things up, too. Think about in-game NFTs: they were worth $3.64 billion back in 2022, and that figure is expected to jump to $15.46 billion by 2027. This shows how deeply NFTs are merging with digital entertainment. And with the new ERC-7857 standard rolling out in January 2025, NFTs are getting smarter by mixing regular digital assets with AI-powered features. This change makes NFTs far more than just digital collectibles, they’re evolving into interactive tools that can be used in real-life applications while giving us sharper market insights. Tech changes and environmental factors are also part of the picture. For instance, when Ethereum made its big shift on September 15, 2022, energy use dropped by over 99%. This move not only helps the planet but also boosts investor trust in a greener, more sustainable digital asset world. Final WordsIn the action, we traced NFT sales trends from 2020 to 2022, analyzed wallet activity, and looked at pricing shifts along with buyer behavior and secondary sales metrics. Each segment offered a peek into key market milestones, demonstrating how data-driven insights have shaped the digital investment space. These nft market insights from historical sales data help guide smart investment strategies and risk management today. Staying informed means you’re better equipped to build a strong, diversified digital portfolio. FAQWhat are the best free NFT market insights from historical sales data?The best free insights reveal key milestones and notable sales trends that help investors understand market growth stages, price history, and trading volumes without a charge. How do NFT market insights from historical sales data for 2021 and 2022 compare?The NFT market insights show that 2021 experienced explosive growth with billions in sales, while 2022 maintained solid activity marked by increased wallet interactions and market consolidation. What does NFT price history show?NFT price history displays a wide range of values, from frequent sales under $200 to headline-making auctions worth millions, highlighting market volatility and shifts in buyer sentiment. How is the NFT market size projected in 2025?Projections indicate that while global market size might contract slightly to around $608.6 million, overall NFT valuations could soar to approximately $49 billion, reflecting evolving market dynamics. What kind of NFT market data is available?Available NFT market data includes sales volumes, wallet activity counts, price ranges, and market cap charts, which collectively provide a comprehensive view of past performance and emerging trends. What does an NFT market cap chart indicate?An NFT market cap chart tracks the total value of digital assets over time, highlighting periods of rapid market growth and offering insights into the overall health and evolution of the NFT market.   Categories:Hot right now:Company:Follow on:We participate in marketing programs, our content is not influenced by any commissions. To find out more, please visit our Term and Conditions page. |

