Ever wonder how each NFT trade tells a story about the market? On-chain activity analysis uses a digital record, a permanent log of every sale, transfer, and wallet move, to give us a clear look at what’s happening. Each trade becomes a snapshot that helps investors follow trends right as they happen. By checking smart contracts (self-executing agreements), trade volumes, and user moves, you can spot changes that might shape your next step. Let’s dive in and see how these real-time insights can fine-tune your digital asset strategy.
Fundamental Components of On-Chain NFT Activity Analysis

The unchanging ledger of the blockchain is the heart of NFT on-chain analysis. Every time an NFT is traded or used, it’s recorded forever on the digital ledger. This means investors can easily see who owns what and watch trading patterns move without any secrets. Think of it as flipping through a photo album where every picture shows a clear moment in market activity.
Another key part is gathering data right from the source. We collect details like transfers, holdings, and trade volumes straight from the blockchain. All these pieces of information come together to show how active everyone is with digital assets. For example, if you notice many wallet actions, it signals that collectors are excited, and that buzz helps investors understand the market’s current energy.
Checking smart contracts and platform performance are also essential for tracking NFT activity. Smart contracts are like self-running digital agreements that automatically log every sale or trade. This helps verify that every transaction is real and boosts trust in the system. Meanwhile, looking at platform performance gives a quick view of how smoothly the whole ecosystem runs, helping you decide your next move with confidence.
Essential Metrics for On-Chain NFT Activity Measurement

On-chain NFT metrics give you a real-time peek into how the market is moving. Many folks use these numbers to spot changes in value, figure out if there’s a lot of selling going on, and get a feel for the market mood. For instance, the MVRV ratio helps you see if a token might be too high or too low in price, hinting at market highs and lows. And when you look at Exchange Flows, you can tell if tokens are coming in or leaving platforms, which often means traders might be offloading their assets.
Then there’s Net Unrealized Profit or Loss, which shows you whether holders are in profit by comparing the market value with what they originally paid. The SOPR, or Spent Output Profit Ratio, checks if NFTs are being sold for more than they were bought, giving a good sense of market sentiment. Other indicators like Open Interest and Funding Rates help track the trading buzz and overall interest from collectors. All these metrics work together using solid blockchain data to paint a clear picture of market activity and help guide your investment choices in today’s fast-moving digital world.
| Metric | Definition | Use Case |
|---|---|---|
| MVRV | Looks at the current market value versus the original realized value to spot pricing issues. | Helps predict market peaks and dips. |
| Exchange Flows | Monitors tokens moving into and out of various platforms. | Signals potential sell pressure. |
| Net Unrealized Profit or Loss | The difference between the current market value and the original value traded. | Shows overall market profitability. |
| SOPR | Checks if NFTs are sold for a gain or a loss. | Acts as a market sentiment tool. |
| Open Interest | Counts the number of ongoing NFT positions. | Measures investor participation. |
| Funding Rates | Represents the cost or benefit of holding NFT positions. | Tracks overall trading volume and interest. |
On-Chain NFT Analysis Tools and Platform Overview
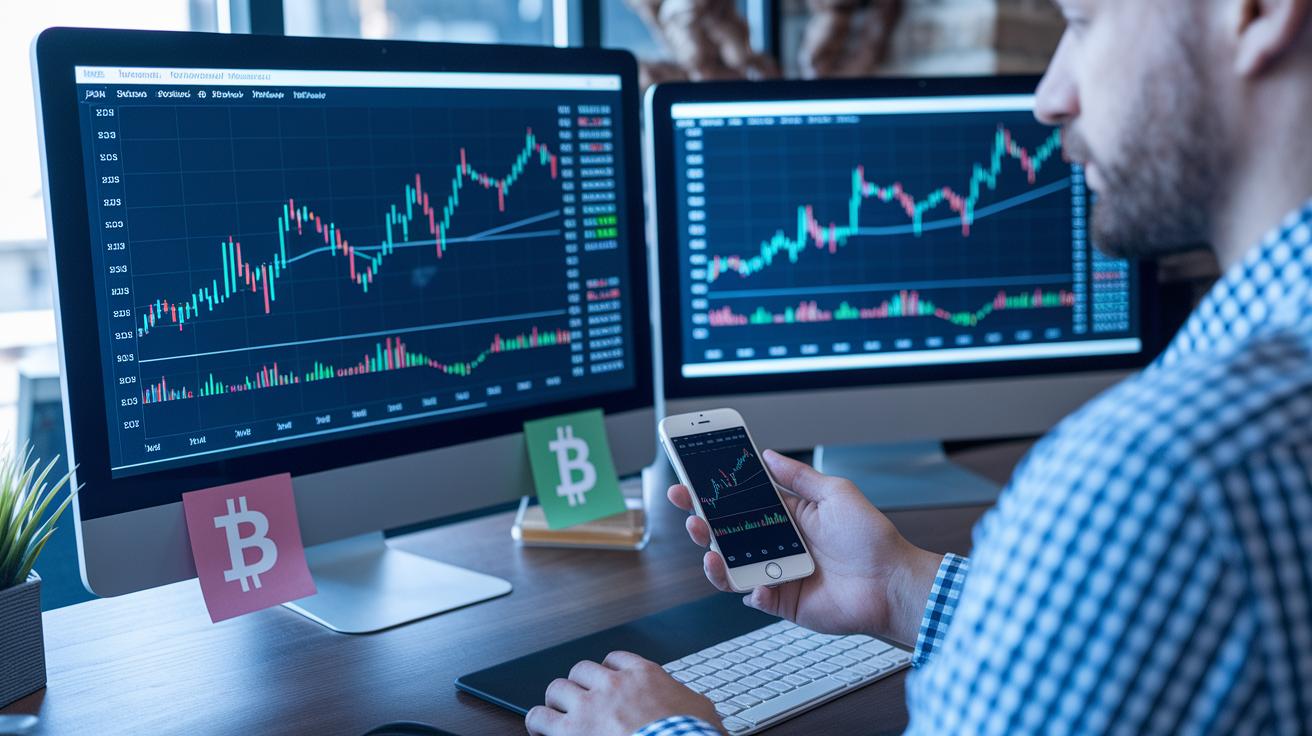
This overview introduces some of the most user-friendly tools that help investors track NFT market activity. Each tool mixes data from the blockchain with community insights to show you how NFTs move and trade in real time.
Nansen pulls in info from several blockchain sources through smart AI dashboards. Over 100,000 investors trust it for clear, reliable reports on network activity. It’s great for anyone looking for an easy way to gauge NFT market trends.
Dune Analytics gives you customizable dashboards built on SQL, letting you see NFT transaction trends as they unfold. With detailed community data and effective tracking of on-chain activity, it’s perfect for diving deep into market dynamics.
Etherscan is a well-known NFT blockchain explorer that lets you inspect transactions and smart contract interactions on Ethereum. Its detailed network audits are essential for verifying NFT activity and making sense of market movements.
Solscan focuses on Solana by tracking both NFT and decentralized finance trends. With a smooth performance gauge, it lets you monitor token movements and offers a quick, clear picture of network activity.
Step Finance provides on-chain insights specifically for Solana. Its integrated app tools and detailed audits help you review marketplace data, track trends, and understand NFT trading behavior with ease.
Hello Moon keeps an eye on wallet actions and social buzz around NFT drops. By combining solid blockchain data with community feedback, it serves as a handy tool for real-time analysis of market sentiment.
Interpreting On-Chain Data for NFT Market Dynamics

On-chain data goes beyond just basic numbers. Instead of giving you the same definitions over and over, think about how mixing different signals like MVRV, Exchange Flows, Net Unrealized Profit, and SOPR can help steer your trading strategy. For example, when MVRV suddenly jumps, it might be hinting that a market reversal is coming. In one case, this quick spike warned investors of a downturn, giving them time to shift their positions. These deeper insights reveal subtle changes in collector interest and show shifts in demand and pricing that simple metrics might miss.
Digging a bit deeper, advanced analysis lets you feel the market's mood. Investors often rely on SOPR to see if traders are cashing out profits or hanging on to their tokens, which offers a real-time peek into market sentiment. And by watching tokens as they move between exchanges, you can catch early signs of trends and shifts in liquidity. When you put these clues together, you build a more detailed view of the market that separates important signals from everyday noise.
So, a key takeaway is to weave these advanced checks into your regular strategy sessions. This way, you can keep an eye on price trends and adjust your approach quickly as digital asset dynamics change.
Building Predictive Models with On-Chain NFT Data

By tapping into on-chain transparency, you can use each block's data to build models that forecast NFT market behavior. In simple terms, historical logs from smart contracts let us see every key event, which helps create features to predict changes in NFT floor prices and shifts in virtual scarcity.
Machine learning and predictive analytics now work hand in hand with this data. Real-time numbers give you the chance to spot odd trends and check model predictions with regression tests. It’s a bit like watching a steady stream of market signals and knowing when things are off track.
By gathering information from different on-chain sources, investors can design models that forecast both volume surges and smaller market shifts. This gives a clear look at trading trends. With these insights, you can fine-tune algorithms to better gauge NFT values and guide smart decisions.
Here’s a simple plan to build a robust forecasting model:
-
Data extraction from smart contract events.
Gather important data like NFT transfers and minting records to build a solid dataset. -
Feature engineering from possession transfer logs.
Use past logs to create features that show price trends and how holders behave. -
Model selection and regression testing.
Pick a fitting predictive setup and run regression tests to make sure the model is accurate. -
Statistical anomaly detection for outlier management.
Set up ways to find and handle unusual data points that might mess up your model. -
Continuous backtesting and insight mining.
Regularly check model predictions against real market moves and refine your approach as you find new insights.
Each step brings you a bit closer to a model that’s both practical and responsive to today's fast-paced NFT market. Isn’t it exciting to see how real data can paint a clear picture of market trends?
Integrating On-Chain Analysis into NFT Investment Strategies

On-chain data gives you a clear, real-time glimpse into the world of digital assets. It tracks each transaction and shows you how funds are moving, so you can quickly spot when selling might spike or market value might drop.
Tracking things like trading frequency and the number of tokens minted helps you see which parts of your NFT collection are active and which are slowing down. It’s like checking the heartbeat of your portfolio to keep everything balanced and to monitor your returns.
For a practical approach, try reviewing your on-chain metrics on a regular basis, sort of like a routine check-up. Watch how tokens move between wallets and see the cash flow on exchanges. This steady monitoring can help you decide if you need to tweak your positions or stick with your current strategy. By keeping an eye on these signals, you’ll manage your risk better, even when the NFT market feels a bit unpredictable.
Final Words
In the action, we covered the core ideas behind tracking NFT market moves. We looked at how on-chain data, from immutable records to smart contract checks, helps investors understand trading patterns. We broke down the key metrics and tools used to gauge market sentiment, forecast trends, and manage risk.
The post showed practical ways to integrate on-chain nft activity analysis into smart investment strategies. With these insights, you can build a flexible portfolio and stay ahead in a fast-changing market. Keep exploring and stay positive as you refine your approach.
FAQ
On chain NFT activity analysis pdf
The on chain NFT activity analysis PDF explains how blockchain evaluation and smart contract verification work to track NFT market trends, offering clear insights into user engagement and trading patterns.
On chain NFT activity analysis free
The free on chain NFT activity analysis provides accessible insights into immutable blockchain records and verified transaction data, making it easier for both newcomers and seasoned investors to understand NFT market behavior.
Best on chain NFT activity analysis
The best on chain NFT activity analysis expertly combines blockchain evaluation, smart contract verification, and data aggregation schemes to deliver precise market sentiment insights and reliable performance metrics for NFT platforms.
Onchain analysis tools
The onchain analysis tools use techniques like smart contract verification and user engagement statistics to review blockchain data, helping investors assess NFT trading patterns and platform performance with clarity.
Onchain analysis course
The onchain analysis course covers how blockchain evaluation and data aggregation work to track NFT market movements, offering hands-on guidance for understanding immutable ledger records through clear, practical lessons.
On-chain analysis PDF
The on-chain analysis PDF outlines key metrics such as platform performance and smart contract details, effectively guiding readers through the process of interpreting verified NFT activity on the blockchain.
Nansen
Nansen is an AI-powered platform that connects blockchain data with onchain performance indicators, enabling investors to review verified NFT transactions and better understand market sentiment confidently.
Onchain analysis crypto
The onchain analysis crypto method applies blockchain evaluation and smart contract verification techniques to monitor digital asset movements, providing clear, actionable insights into token ownership and market trends.