
Have you ever felt like your NFT investments are on a wild ride? One tweet or a big sell-off can flip prices in just moments, almost like tossing a coin.
In this chat, we break down why NFT values, those unique digital items you can buy and sell, can jump so quickly. We look back at big moments in the market and point out trends that help explain these rapid changes.
Stick with us, and you might find it easier to spot these quick moves and adjust your strategy when the market takes a twist. Isn’t it interesting how fast things can change?
NFT Volatility Trends Overview: Understanding Market Fluctuations

NFT prices can change in just minutes or even seconds, almost like watching ripples spread across a pond. One big comment from a well-known person can drop an NFT’s value in a flash. It’s wild, isn’t it? This fast pace shows just how sensitive the market is to even small shifts.
In 2024, the market took a 19% hit. Big moves like celebrity tweets or massive sell-offs by so-called “whales” can start a chain reaction. Imagine one major investor selling a huge number of NFTs, and suddenly, prices plummet in minutes. It makes you wonder, are you ready to stay on top of such rapid changes?
Forecasting in this space is more than just reacting day-to-day. Investors look back at past trends and check real-time market moves to figure out what might happen next. They set exit points and compare current performance with what happened before, kind of like keeping an eye on a moving target. In short, understanding these trends helps everyone navigate the ups and downs of the NFT market while managing risks along the way.
Historical Patterns in NFT Price Volatility

NFT prices have been like a roller coaster, swinging wildly from high peaks to deep valleys. You know, they tend to skyrocket when everyone's excited and then suddenly drop as that buzz fades away.
Over the years, a few key moments have really shown these ups and downs in action. As market mood shifted and outside events kicked in, we saw prices bounce up and then take a hit.
- Late 2020: CryptoPunks grabbed the spotlight, sending prices up by about 40%.
- Q2 2021: A quick peak followed by a crash saw prices fall nearly 35%.
- October 2021: A shift in what collectors wanted led to an approximate 25% drop.
- Mid-2022: The wider crypto bear market nudged NFT floor prices down by roughly 20%.
- Early 2024: A sharp dip of 19% occurred, as detailed in the nft market crash analysis (https://nftworthit.com?p=368).
Understanding these past shocks is crucial if you’re trying to manage risk. When you spot a similar pattern today, it might just be part of the regular cycle, or it could be a sign of a bigger change. By looking at these trends, you can get a better feel for market strength and decide if it's time to tweak your portfolio.
nft volatility trend analysis: Bright Market Vibes
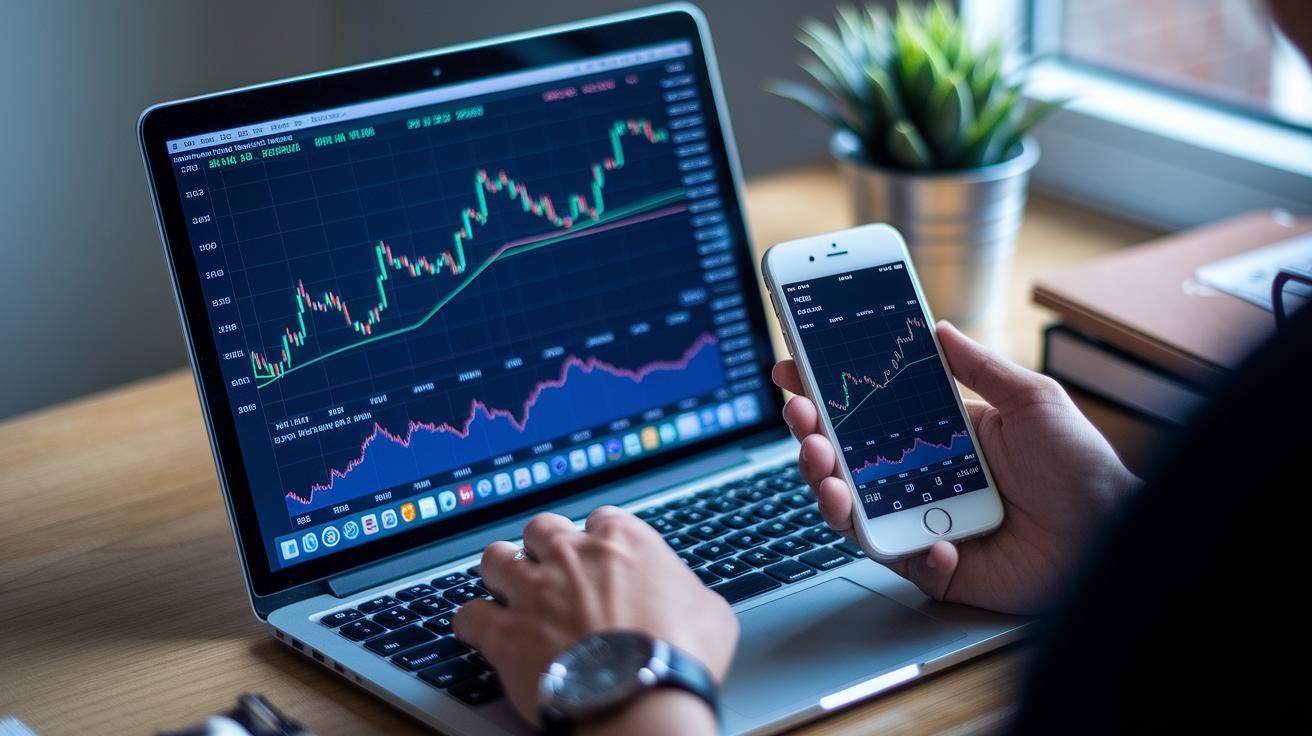
NFT market moves can be a bit unpredictable, but using easy-to-follow metrics makes them a lot clearer. Investors check a few main numbers to see where value piles up, spot new demand, and notice any odd trading patterns. These insights help create a smart picture of market ups and downs.
Standard Deviation & Volatility Index
This number tells us how much daily returns bounce around. In simple terms, it shows how much NFT floor prices jump or drop each day. Think of it like watching a stock’s price change on a busy day. When prices stay close together, things are steady; when they spread out, the market might be more wild.
Total Unique Holders & First-Time Buyers
Counting Total Unique Holders shows how many different wallets hold tokens. It’s a good way to see if a few big holders dominate or if many people own a piece. Also, First-Time Buyers highlight new interest in a project. For example, if a collection suddenly attracts lots of newcomers, it signals growing trust and demand, kind of like a neighborhood getting its first wave of home buyers.
OTC Activity Monitoring
Keeping an eye on off-market sales through smart contracts can reveal when serious, big trades are happening. If major players are trading away from public listings, it might mean they’re repositioning for a big move. This kind of activity can tell you if market makers are gearing up, hinting at upcoming stability or wild swings.
Network Analysis Techniques
This approach uses graph clusters to map out wallet interactions and trading groups. It helps spot clusters of wallets that trade frequently with each other, which might mean a group of insiders or collectors is quietly steering the market. Watching these patterns gives you a fuller view of market behavior beyond just the price numbers.
In short, by mixing these detailed metrics, investors can build a solid framework to capture both daily price swings and the deeper market behaviors. This balanced approach makes it easier to spot risks and opportunities, ensuring you’re always in tune with the market vibe.
NFT Volatility vs. Traditional Market Volatility: A Comparative Study

NFTs can zoom up or down in price in just a few minutes or hours. For instance, in 2024, some NFTs lost almost 19% of their value in a single day! In contrast, Bitcoin usually shifts by about 5-10% each day and the S&P 500 moves by only 1-2% daily. This shows just how quickly digital collectibles can change compared to regular investments.
Traditional investments, like stocks, tend to shift more slowly, often taking days or even weeks to show big changes. Investors dealing with these quick moves balance risk and reward while looking for chances to earn good returns. They combine careful study and a mix of different investments to keep pace with sudden market swings. That’s why using special tools to track the market can be really important.
| Asset Class | Example Volatility Event | Typical Time Frame |
|---|---|---|
| NFTs | Intra-day 19% drop | Minutes to hours |
| Bitcoin | Daily 5–10% shifts | Daily |
| S&P 500 | Day-to-day 1–2% move | Daily to weekly |
Methodologies for Predicting NFT Price Movements
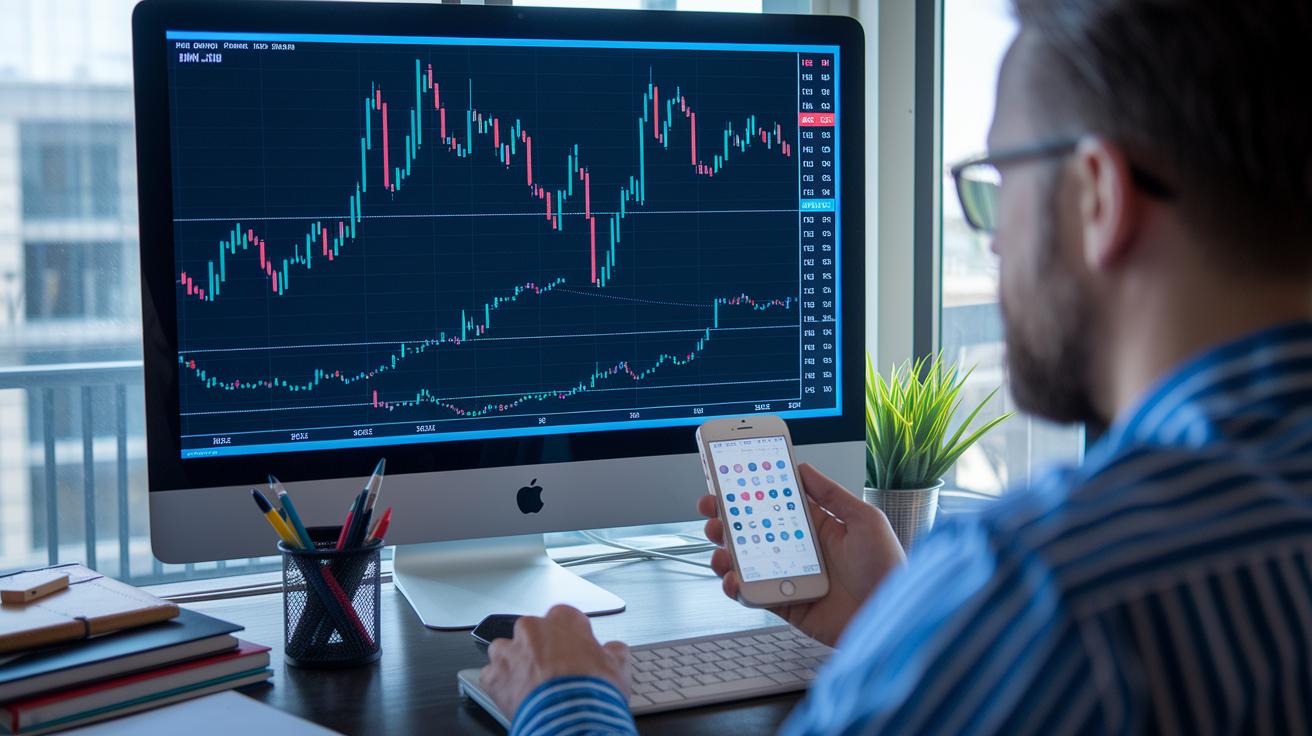
Technical analysis is one main way we try to forecast NFT price shifts. Experts use simple tools like moving averages and the relative strength index (RSI), which looks at how prices have been moving over time. For example, imagine the 7-day RSI climbing above 70, it's like watching a thermometer rise on a hot day, hinting the market might be heating up. Tools like these, mentioned on platforms such as "Using Historical Data for Trend Analysis," help traders compare today’s momentum with past trends to catch potential turning points.
Sentiment models bring a friendly, human touch to predictions. They watch real-time chatter from sites like Twitter or Discord to see how buyers and sellers really feel. Imagine a flood of tweets excitedly talking about a new NFT drop; that kind of buzz can signal a quick, short-term rise. By comparing these spikes in mood with past data, investors can spot clues that might not show up on traditional charts.
Machine learning is another helpful tool. It uses computer models that learn from past price data and wallet activities, using methods like regression and classification. Simply put, if a model predicts a 5% price swing based on recent activity from key wallets, it turns past patterns into forecasts you can use. This modern approach works well alongside classic technical tools to give a fuller picture of the market.
Risk management is key too. Smart investors set up strategies with stop-loss and stop-gain orders, which act like safety nets. Think of a stop-loss as a backup plan that helps cut losses if NFT prices suddenly drop. Pairing these risk tools with solid research, like checking project roadmaps and historical trends, builds a strong framework to navigate the ups and downs of the NFT market.
Case Study: Volatility Trends in Leading NFT Collections
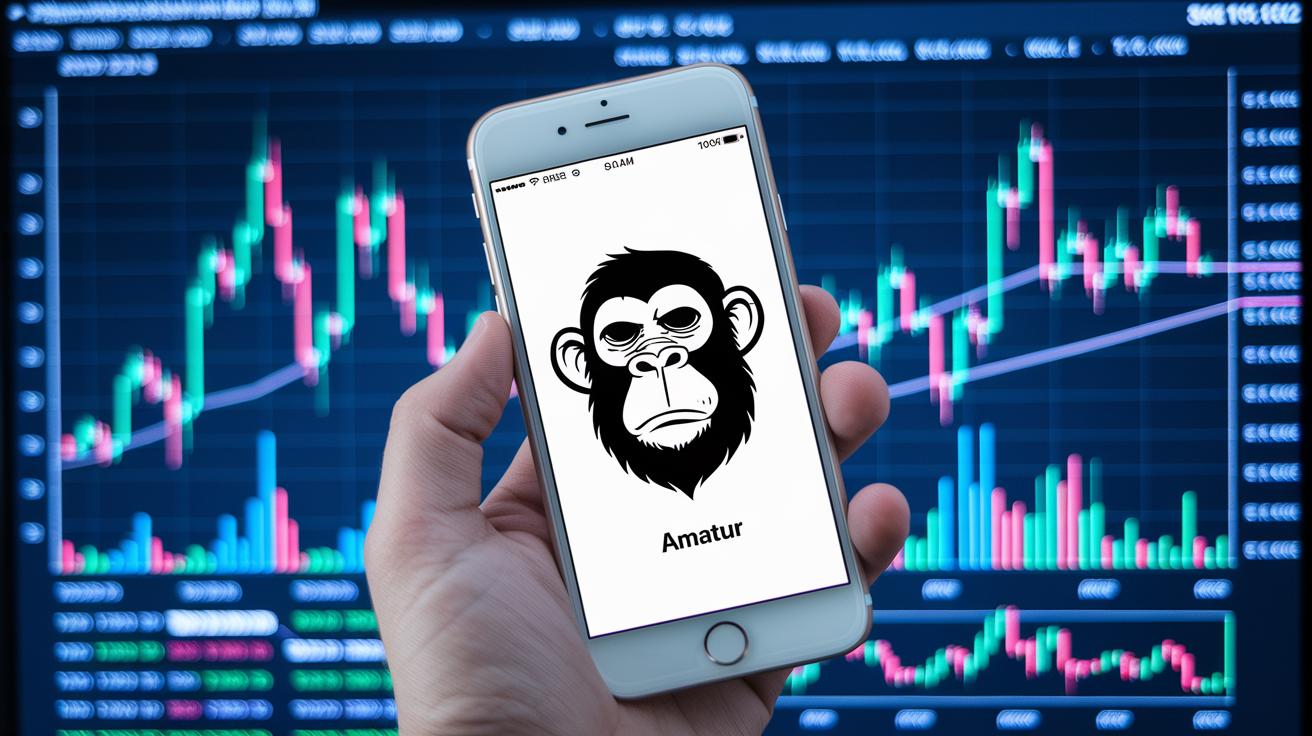
CryptoPunks show us just how unpredictable the NFT world can be. In 2021, their floor prices jumped over 30% in a single day. This huge change came from a mix of a few holders controlling more tokens and many first-time buyers jumping in. When a couple of wallets began buying large amounts, the prices reacted quickly. It’s a clear sign of how fast market sentiment can flip and shake up a community built on digital rarity.
Bored Ape Yacht Club (BAYC) has had a much calmer journey. After launching, BAYC’s daily price swings averaged about 5%, which shows a steadier trend despite the initial excitement. This calmness comes from a mix of seasoned collectors and new buyers who keep the market balanced. Think of it like a clock that ticks evenly, each change in buyers helps smooth out the bigger price moves, making the overall trend more predictable.
Local trends also matter a lot. In regions such as Asia and California, active chats on platforms like Discord and Twitter help keep NFT prices stable. When groups of traders act in sync, they give investors clear signals. This makes it easier to tell when the market mood is shifting from frenzied to relaxed.
Tools and Platforms for NFT Volatility Tracking

Have you ever wished you could catch NFT market moves the instant they happen? Platforms like Nansen and Dune Analytics let you do just that by showing live updates on floor prices and trading volumes. Their on-chain dashboards, which display real-time data, make it easy to see when the market shifts. Plus, when these tools work with your portfolio tracker, you get a neat, all-in-one view of your digital assets.
Then there are social sentiment tools such as LunarCrush. These tools pick up on chatter from social networks to gauge the mood of the market. So, when excitement or caution sweeps through digital communities, you’ll know right away. It’s a bit like checking the weather before a big day, helpful and reassuring.
Risk management tools add another smart layer to your strategy. They offer features like alerts, stop-loss triggers, and portfolio correlation dashboards that automatically warn you when the market takes a sudden turn. This means you can quickly adjust your game plan as needed. For a deeper dive into setting up these dashboards, check out the Interactive Investment Tool Tutorials, which walk you through each step.
Final Words
In the action, we explored NFT volatility, key market drivers, and historical price shifts. We broke down major events, critical metrics, and compared digital asset behavior with traditional markets. The analysis also highlighted forecasting techniques and risk management tools, helping you piece together a full picture of market dynamics.
This nft volatility trend analysis offers fresh insights to guide smart decision-making. Keep experimenting with these strategies, and remember that stable growth can come from learning and adapting along the way.
FAQ
Frequently Asked Questions
What do NFT volatility trend analysis reports from recent years (2021, 2022, and available PDFs) show?
NFT volatility trend analysis reports highlight rapid price shifts. They reveal key factors like celebrity tweets and large-value sell-offs that cause swift fluctuations and help investors assess risk.
How do volatility spillovers across NFTs affect market news and broader financial trends?
Volatility spillovers in NFTs indicate that price swings can influence market news and shift financial sentiment. They show how changes in digital asset prices may ripple into overall investor attention and market behavior.
What does NFT coin price prediction for 2030 suggest?
NFT coin price predictions for 2030 suggest a range of outcomes based on market trends, user adoption, and risk factors. Forecasting relies on past data and evolving market dynamics to guide future investment decisions.
Will NFTs remain popular in 2025, or is the NFT craze over?
NFT popularity is expected to continue into 2025. While early hype may have stabilized, digital collectibles still maintain interest due to ongoing innovation, community engagement, and emerging use cases.
Are NFTs volatile, and do their values tend to drop?
NFT values are often volatile, with prices swinging widely in short periods. Specific collections may face quick drops after sharp sell-offs, so monitoring market trends and risk is key for potential investors.