
Who is NFT Market Analysis for?
If you are an investor or manager looking to uncover real value in the digital world, this guide is designed with you in mind. Instead of guessing what drives the market, you can rely on clear figures to tell you the story behind each NFT asset.
What can you learn from the numbers?
Every digital asset carries a narrative written in daily active users, trading volumes, and price trends. Examining these figures helps you see how users interact with the market and evaluate its overall health.
Why invest in understanding these metrics?
By diving deep into these vital indicators, you unlock insights that lead to smarter choices. This analysis cuts through the complexity to reveal the hidden strengths of NFT platforms, empowering you to make decisions with confidence.
Core NFT Market Performance Metrics You Should Monitor
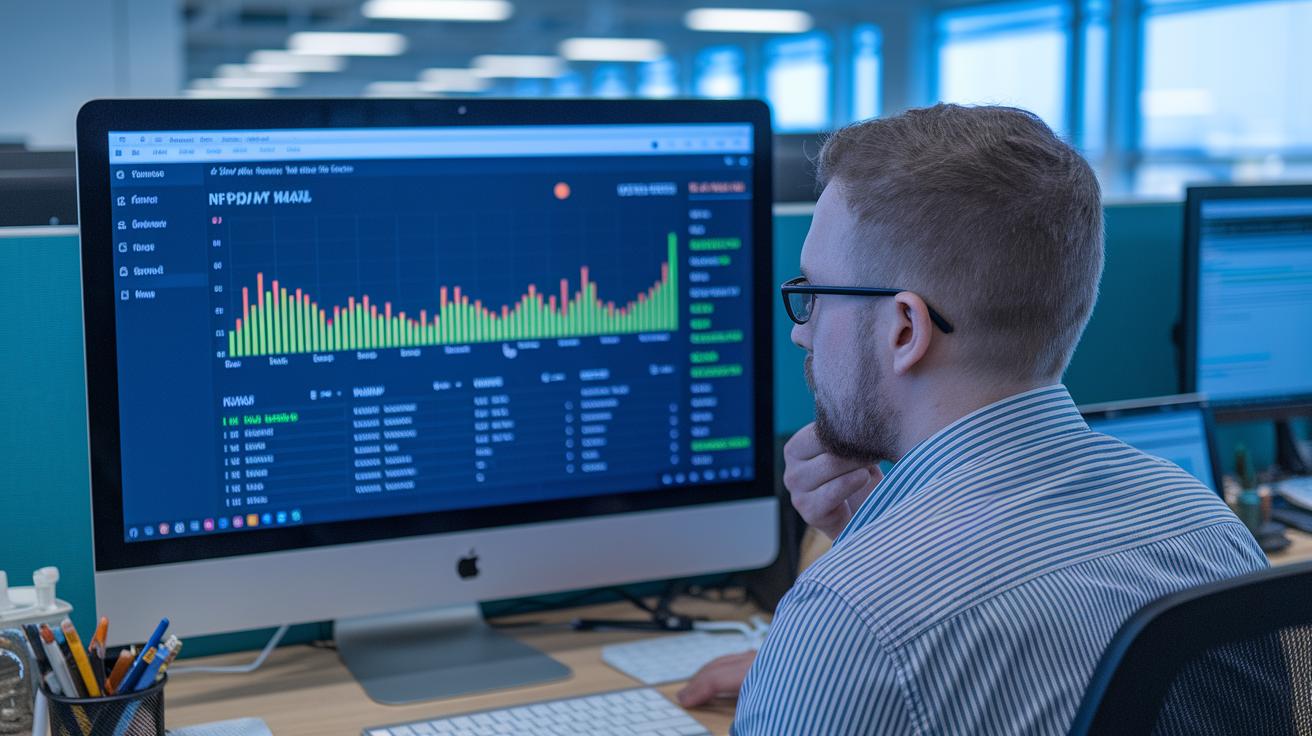
Platforms operating in the NFT field encounter high demands for data processing, which makes monitoring performance metrics absolutely vital. User analytics such as Daily Active Users and Monthly Active Users deliver valuable insights into platform engagement, allowing decision makers to observe real-time patterns that influence strategic choices. When these metrics are seamlessly integrated into tracking systems, they provide stakeholders with a clearer picture of how collectors and investors interact in this evolving market.
Equally important are transaction metrics when evaluating the overall health of the market. Metrics such as total volume traded and detailed floor and ceiling price analysis offer direct evidence of liquidity and pricing trends. By separating on-chain events from off-chain activity, market participants can gain refined insights that help reveal hidden trends and predict future movements. The use of advanced, real-time data analysis tools further aids in setting clear and measurable key performance indicators.
Bringing these core metrics together unlocks actionable insights that drive data-focused strategies and encourage sustainable growth. When clear KPIs emerge from comprehensive user and transaction analytics, platforms are better positioned to remain competitive in a rapidly changing NFT landscape. By continuously reviewing this aggregated data, investors and managers can confidently balance risk management with innovation while obtaining meaningful insights into market performance.
User Behavior Analytics in the NFT Market

NFT platforms tap into everyday user numbers to capture the real pulse of market engagement. By monitoring Daily Active Users (DAU) and Monthly Active Users (MAU), investors gain a clearer picture of how regularly collectors visit and interact with the platform. These figures also serve as early warning signs of emerging trends and shifts in adoption speed. A sudden boost in DAU, for instance, might signal a popular NFT drop or trending sale that is drawing in more collectors.
Looking at engagement and conversion rates turns raw numbers into meaningful insights. The engagement rate shows how involved users are with the platform’s features, while the conversion rate links visitor activity directly to sales outcomes, clarifying overall performance. This data helps in calculating return on investment where every user interaction counts. Key metrics to track include:
- Daily Active Users (DAU): Captures daily engagement and immediate trends.
- Monthly Active Users (MAU): Reflects ongoing interest over a longer period.
- Engagement Rate: Indicates how often users interact with available content and tools.
- Conversion Rate: Measures the success of turning interactions into NFT sales.
Regular analysis of these user-centric metrics allows platforms to fine-tune their strategies to better align with collector behavior. This proactive approach helps ensure that NFT marketplaces stay flexible while enhancing user experiences and driving revenue growth.
Transactional Volume and Liquidity Measures in NFT Markets
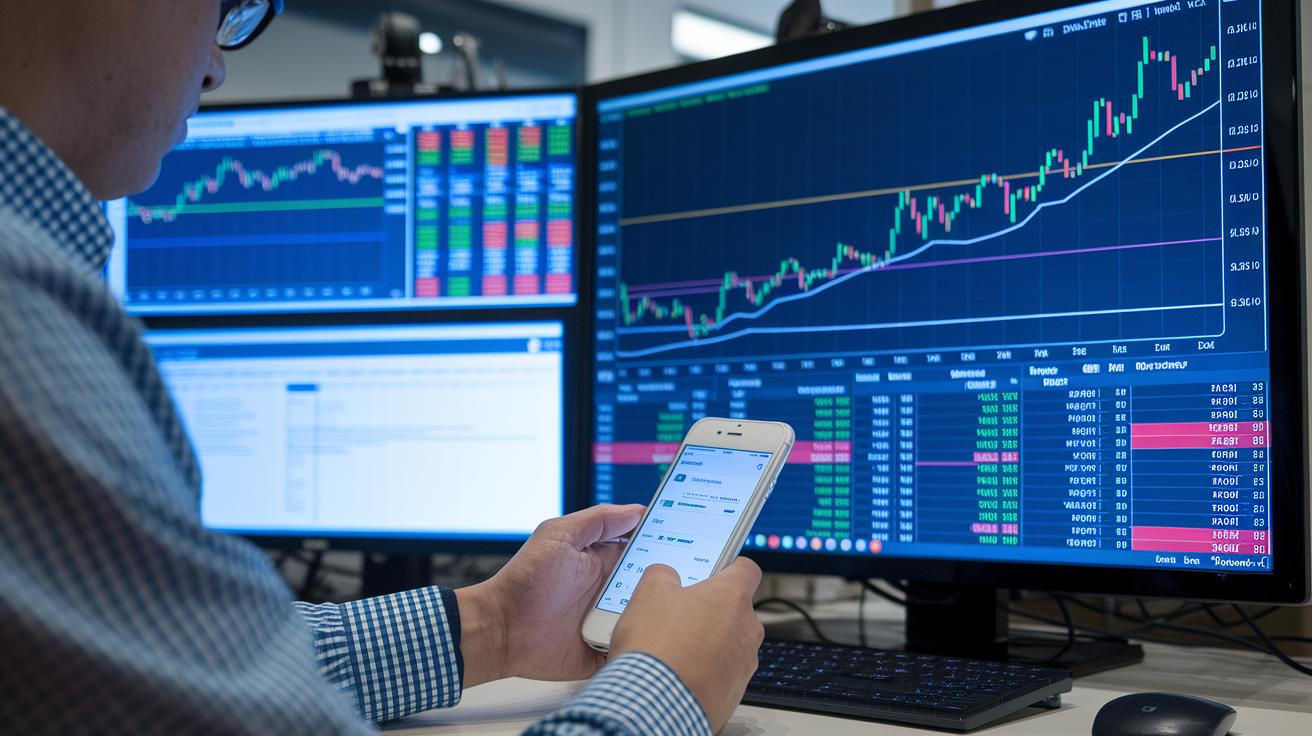
Total volume traded serves as a straightforward indicator of activity within NFT collections. By examining this figure over defined periods, stakeholders can recognize trends in rising or falling engagement. For example, a high-demand release that causes a notable surge in trading volume clearly demonstrates strong market involvement and promising liquidity conditions. This metric also sheds light on how rapidly assets are bought and sold, pointing to possible shifts in a collection's popularity.
Studying the lowest and highest listing prices further clarifies market dynamics. The floor price, which is the least expensive listing in a collection, combined with the ceiling price, indicating the upper limit of listings, helps establish the overall valuation range. In conjunction with the liquidity ratio, the total traded volume divided by the supply available for listing, these measures reveal important nuances in buyer and seller behavior. Together, they help identify specific areas where market strengths or inefficiencies might be developing.
Observing secondary sales provides an additional layer of insight by tracking the performance of NFTs after their initial release. This approach measures ongoing interest and hints at potential future price increases. By considering total volume traded, pricing boundaries, and liquidity ratios, participants gain a comprehensive view of market fluidity, enabling more confident and strategic decision-making in a constantly evolving marketplace.
Rarity and Scarcity Indices in NFT Market Valuation

In the fast-moving world of NFTs, rarity and scarcity indices act as key measurements that define pricing and steer investment choices. These measurements explain how many copies are available and help highlight what gives each asset its unique appeal. For example, picture owning a digital asset with a rarity rank that makes it stand out among thousands of similar tokens. This distinct characteristic can increase its overall value in the market.
In addition to measuring quantity, verifying the history of ownership plays an important role in confirming authenticity and enhancing the calculation of rarity. Knowledge of provenance enriches the data provided by scarcity metrics and helps build trust in the asset's uniqueness. This combined approach offers a comprehensive method for determining market value, which is especially useful for art collectors and experienced investors venturing into the digital economy.
| Metric | Definition |
|---|---|
| Supply | Total available number within a collection |
| Rarity Rank | Relative scarcity score based on unique attributes |
By integrating rarity indices with scarcity evaluations, investors gain a clearer understanding of an NFT's position in the market. This insight helps them decode supply details, determine the level of exclusivity, and assess potential for future value appreciation while making informed decisions in a dynamic digital marketplace.
Price Volatility and Return Estimation in NFT Markets
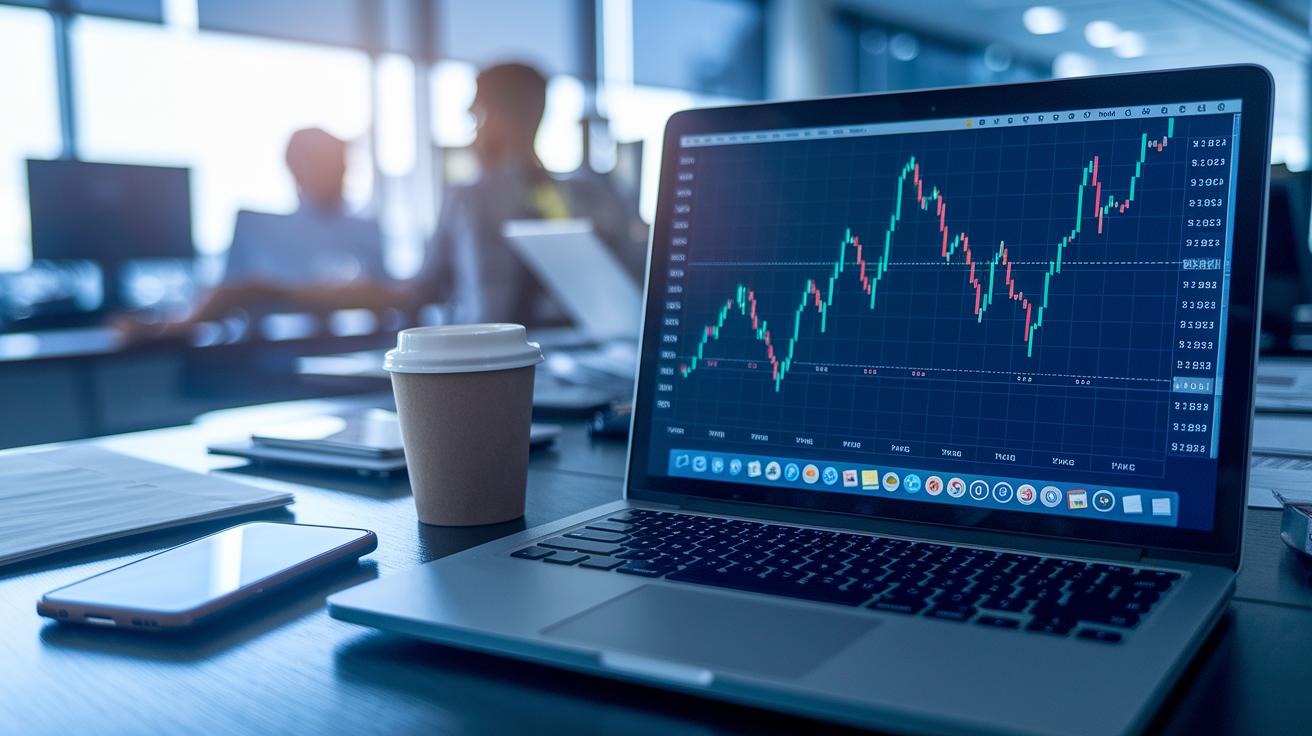
NFT market movements are best understood by tracking changes in sale prices over time. By using the standard deviation of these prices, we can see how widely an asset's value varies. If a collection shows a broad range of sale prices within a brief period, it points to increased volatility and higher potential rewards and risks.
Return yield estimation takes a closer look at the difference between the original purchase price and the secondary sale price of an NFT. This method helps investors understand both immediate earnings and longer-term value growth. For instance, if a digital collectible's price doubles or triples after purchase, the return calculation confirms its strong performance and supports more informed investment decisions.
Evaluating market sentiment adds another layer of insight by considering social media trends and trading behavior. A surge of positive online discussions about a new NFT drop can signal growing buyer interest. By blending numerical data with these qualitative clues, investors are better positioned to balance risks with opportunities and adjust their strategies as the market evolves.
Comparative Analysis of NFT Metrics Against Traditional Market Indicators
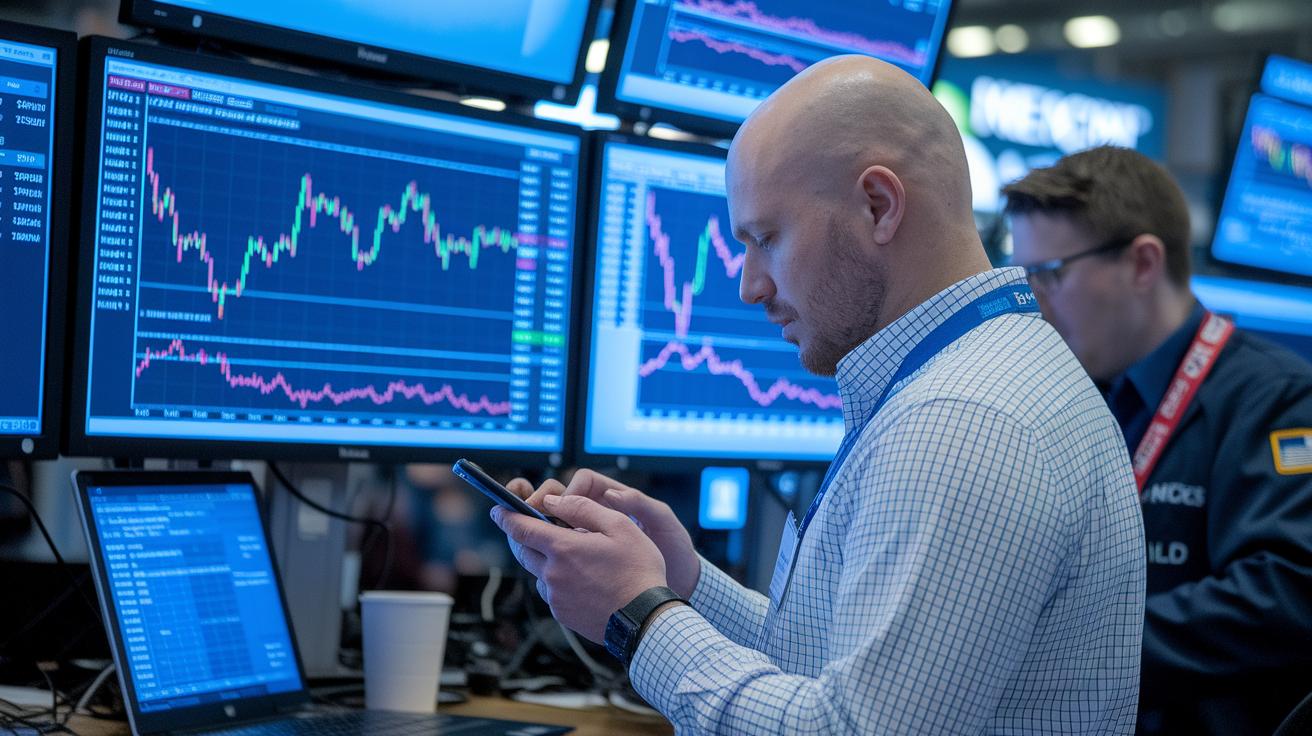
Conventional market measures like price-to-earnings ratios and trading volume help guide investments in established equities. In the world of NFTs, indicators such as floor price trends and overall sales volume offer similar insights into market sentiment and liquidity. This comparison proves that basic economic concepts also apply to digital assets, allowing investors to use well-known analytical techniques when evaluating NFT market performance.
Diversification is essential regardless of the asset class. Experts advise that NFT investments should account for no more than 10 to 20 percent of a portfolio, mirroring strategies in traditional investment management designed to avoid overexposure. This cautious allocation helps manage the increased volatility and speculative nature of digital assets, emphasizing the importance of careful risk management.
NFT markets experience rapid changes that require a dynamic approach. Price variations and cyclical trends in the digital sphere often echo those seen in mature markets. By comparing NFT metrics with traditional market signals, investors can better understand the underlying factors driving price changes. This analysis underscores that, despite market unpredictability, a well-informed strategy and ongoing performance review are crucial for sustaining long-term success.
Tools and Best Practices for Monitoring NFT Market Performance Metrics

Reliable analytics systems form the foundation of any thriving NFT platform. By merging real-time on-chain data with off-chain information using tools like Multibase, teams can accurately track sales trends and user engagement. In addition, these systems integrate smart contract checks and plan for protocol updates. This approach includes setting up API feeds, designing intuitive dashboards, and scheduling alert notifications. Choosing a trusted NFT marketplace is essential when it comes to combining various data streams into clear, actionable insights.
Building an effective monitoring system requires a thoughtful strategy. Merging on-chain stats with off-chain data offers a complete view of market dynamics, ensuring no important detail is overlooked. By following a systematic implementation plan, teams can strengthen their infrastructure and stay agile in a fluctuating market. Key steps in this process include:
- Set up API feeds to deliver real-time information on sales and user engagement.
- Design user-friendly dashboards that blend data from both on-chain and off-chain sources.
- Implement automated alerts to quickly identify any data irregularities or market changes.
Using these practical measures builds a resilient platform that adjusts to the fast-changing NFT landscape. This strategy empowers stakeholders to make informed, data-driven decisions that support long-term growth.
Final Words
In the action, our discussion dissected key aspects of the digital asset arena, from engagement data and transactional liquidity to asset rarity and volatility trends.
Each section highlighted how informed decision making is supported by thorough on-chain statistics review, ensuring a robust market perspective.
By tying together user behavior and traditional market benchmarks, the piece emphasizes nft market performance metrics explained. Embracing these insights fosters a dynamic approach that fuels growth and success in this ever-evolving market.
FAQ
Is NFT worthless now?
The idea that NFTs are worthless now overlooks their inherent value tied to uniqueness, community backing, and technological utility. Market trends and specific asset qualities continuously influence their worth.
How to know what NFT will gain value?
The method for determining which NFT may gain value involves analyzing indicators such as rarity, market activity, community engagement, and data-driven insights from trusted analytics tools to forecast potential growth.
Is NFT still relevant in 2025?
The question of NFT relevance in 2025 is addressed by noting that ongoing blockchain innovation, evolving use cases, and growing adoption suggest that NFTs will continue to hold significance despite market fluctuations.
How is the NFT market doing right now?
The current state of the NFT market is gauged by dynamic performance metrics including transaction volumes, liquidity ratios, and user engagement trends, which together provide a real-time snapshot of market health.