
Have you ever checked crypto prices and felt like you were on a roller coaster? You’re not alone. In the world of digital currencies, prices can jump quickly, and while that might seem wild, many investors see these jumps as hidden chances to benefit.
Imagine a busy marketplace where bids change all the time. Some folks play it safe while others take bold moves. What looks like confusion at first can actually spark new trends, turning risk into a chance for gains.
So next time you notice these rapid shifts, remember: even apparent chaos can open the door to exciting opportunities.
Understanding Crypto Market Volatility: Definition and Context

Crypto market volatility is all about how wildly digital currency prices can change in a short time. Since crypto is still a new type of asset, its prices can swing a lot more than those of big company stocks or U.S. Treasuries. Imagine riding a roller coaster that suddenly drops and climbs, that’s how quickly a digital asset’s value might shift in just a few hours.
Several factors play a part in these rapid moves. Quick changes in market mood, new trends in digital finance, and updates in the technology behind these currencies all drive these price jumps. It’s like watching the tide shift; sometimes the change draws in cautious investors, while at other times, it excites the more daring ones.
Think of it this way: picture a marketplace where the price changes every minute. One moment, Bitcoin could be soaring, and the next, it might take a steep dive, just like an unexpected weather shift. This simple image helps explain why crypto prices often change so fast. In short, crypto volatility creates a landscape full of both risks and opportunities, giving us plenty to analyze as we try to understand market behavior.
Crypto Market Volatility Sparks Positive Analysis
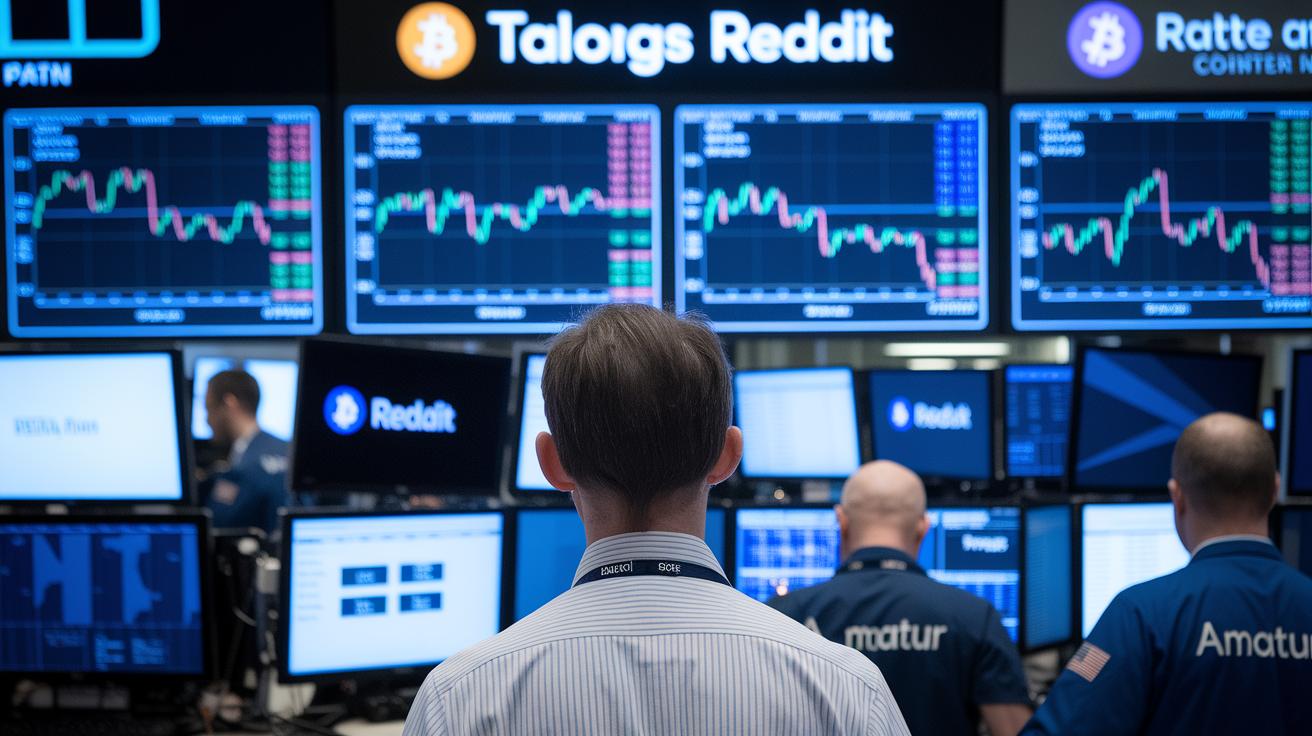
Crypto market swings come from several key factors that shape its ups and downs. The hunt for a token's true value heats up as more people join in, much like a fast-paced auction where every bid sends prices soaring or tumbling. Did you know that early fans of digital tokens watched prices jump wildly, much like collectors at a rare auction?
Retail investors, quick to react to the latest news, stir up the market even more. Newcomers often jump in when they catch wind of a rumor or unexpected event, sparking sudden bursts that can send prices flying.
Other big factors include the fact that many crypto systems are still a work in progress and the financial products tied to crypto are constantly evolving. Because these trading tools aren’t as stable as those in traditional markets, surprises are always around the corner.
These drivers include:
- The ongoing discovery of a token’s value as more people adopt it
- Trading tools and systems that are still maturing
- A natural push and pull in digital asset supply and demand
- Quick reactions from retail investors to everyday news
- Gaps in regulation since crypto operates on a decentralized setup
- Non-stop, 24/7 trading that never gives the market a break
All these factors create a market that can be unpredictable but also full of opportunities for savvy investors. When you understand these forces, you can read the market signals better and adjust your strategy accordingly.
Historical Patterns in Crypto Market Volatility and Price Swings

Crypto markets can change in the blink of an eye. For instance, Bitcoin recently drifted between $125,000 and $120,000 in just a few weeks. This happened when the U.S. government faced a possible shutdown and some shaky economic numbers made everyone nervous. Even traditional commodities got involved, silver, for example, almost hit $50 a shot before dropping nearly 4%. Such shifts in one part of the market can really sway how investors feel across the board.
Leveraged trading adds even more drama. When more than $600 million got liquidated, it highlighted just how high the risks are. With Bitcoin now holding over 59% of the market, many see it as a safe bet amidst all the volatility. It’s like watching a storm roll in; every swift dip or sudden spike sends a signal about market emotions and moves funds between different investments.
| Event | Price Change | Trigger |
|---|---|---|
| Bitcoin fluctuation | $125k ↔ $120k | macro uncertainty |
| Silver swing | ~$50/oz → -4% | commodity link |
| Liquidations | Over $600M | leveraged trading stress |
These historical patterns show us just how interconnected the markets are. When one asset moves, it often sets off a chain reaction across the board, reminding us that the world of crypto is as thrilling as it is unpredictable.
Measuring Crypto Market Volatility with Technical Indicators

Technical analysis is like a toolkit that helps you see how wild coin prices can get. Take Bollinger Bands, for example. This tool calculates a simple moving average and then adds lines based on how much prices usually vary. When these bands widen, it’s a sign that prices are swinging a lot; when they tighten, things are settling down.
Another reliable indicator is the Average True Range (ATR). ATR measures the typical distance between the highest and lowest prices over a set period. When ATR rises, it tells you that the market is buzzing with activity. When it drops, you can expect calmer rounds.
| Indicator | What It Tells You |
|---|---|
| Bollinger Bands | Wider bands mean bigger swings, while narrow bands hint at a calm market. |
| Average True Range (ATR) | A rising ATR shows more activity, and a lower one means a quieter pace. |
These tools help you get a clear view of how digital coin prices stretch and contract over time. They can guide you through the fast-moving rhythm of the crypto market. For more details, check out Trend Analysis Indicators Explained at https://tradewiselly.com?p=2456.
Crypto Market Volatility: Implications and Risk Management Strategies
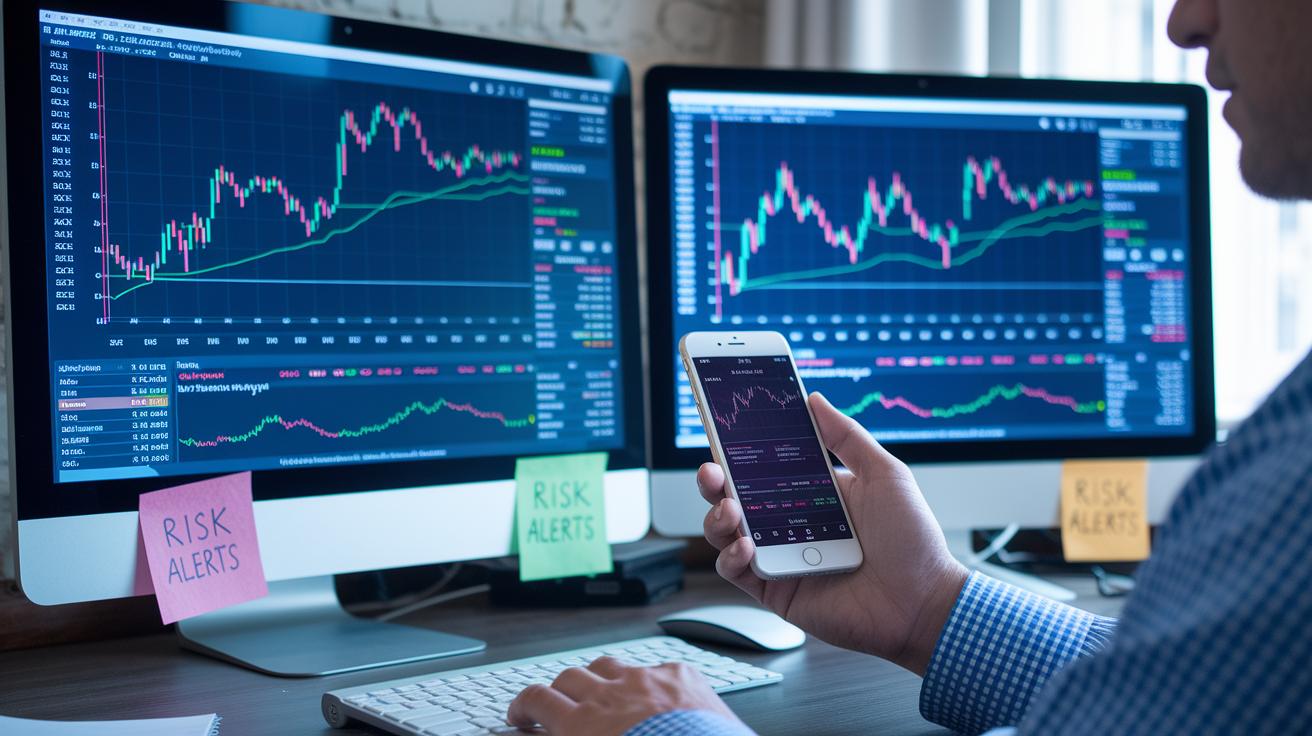
We’ve seen how the crypto market is more than just big numbers, digital money can move in a flash. For example, some days have seen over $600 million in leveraged trading liquidations, and BlackRock’s Bitcoin ETF gathered $70 billion almost overnight. When Bitcoin drops below around $121,500, many traders notice both risk and opportunity. It’s clear that these rapid swings don’t just look dramatic, they affect trades and the health of your portfolio.
If you trade crypto on a short-term basis, having a solid risk management plan is key. When prices change in minutes, you want a system that protects your money. You need both careful analysis and a lot of patience. Using strong risk controls and simple techniques can help keep you confident and avoid heavy losses.
Here are five practical risk-management techniques you can use:
| Technique | Description |
|---|---|
| Position Sizing | Adjust your trade size based on how much market change you can handle. |
| Stop-Loss Orders | Set orders to automatically sell if prices drop suddenly. |
| Diversification | Spread your investments across different digital assets to reduce risk. |
| Monitor Liquidation Levels | Keep an eye on signs of market stress, such as high liquidation levels. |
| Patience in Execution | Stick with your strategy and wait for the right trade opportunities. |
If you want more detailed advice on managing digital finance risks, check out Digital Finance Risk Management at https://nftcellar.net?p=715. For more ideas on trading methods that work well with these strategies, see crypto trading strategies at https://nftworthit.com?p=101. Embracing these tactics can help keep your portfolio on track even when the market is wild.
Altcoin Volatility in the Crypto Market: Case Studies and Trends
Ethereum, BNB, and DOGE have been dancing to their own beat when the market gets wild. In just one day, these coins can jump up or down by 8–12%, often following Bitcoin’s big moves while showing their own unique ups and downs. It’s like watching a group of friends react differently to the same news, each altcoin tells a story about how investors feel and the energy in trading.
Then there’s the curious case of the Trump Coin meme-coin ETF that popped up in 2025. This quirky token has thrown a spotlight on how wild and speculative some parts of the market can be. Meanwhile, the memecoin scene on the BNB Chain is seeing heavy sell-offs, with whispers of market tricks and cash flow problems making investors a bit nervous. It’s a reminder that meme-coins can be as unpredictable as a roller coaster and clearly show how connected altcoins are to the overall crypto ride.
In short, these trends show that altcoins are very sensitive to the broader market mood, offering both new opportunities and some cautionary signals.
Final Words
In the action, we broke down what crypto market volatility means, explained the forces behind dramatic price swings, and recalled real-life events that shape digital asset trends. We also shared simple technical tips for measuring risk and suggested sound risk management techniques for when prices fluctuate sharply. The blog’s insights can help you build safer portfolios and seize potential opportunities, even when crypto market volatility shakes things up. Stay curious, and keep a steady eye on your investments.
FAQ
Q: What does the crypto market volatility chart tell us about current trends and historical data?
A: The crypto market volatility chart shows price swings both today and in past periods like 2021 and 2022. It highlights rapid changes in digital asset prices due to shifting market sentiments.
Q: What tools track crypto market volatility?
A: Crypto volatility trackers and lists deliver real-time updates on price movements. They help traders review market fluctuations and spot periods of increased trading potential.
Q: Which cryptocurrencies are known for high volatility, especially for day trading?
A: Cryptocurrencies such as XRP, Dogecoin, Ethereum, Solana, Shiba Inu, and Litecoin are known for quick price movements. Their active trading scenes attract day traders looking for short-term opportunities.
Q: What is the 30 day rule in crypto?
A: The 30 day rule in crypto often advises waiting a full month before repurchasing similar tokens. This approach is used to manage tax concerns related to wash sale rules in trading.
Q: Is crypto becoming less volatile?
A: Although some periods offer calmer price movements, crypto remains highly volatile due to continuous trading and shifting investor sentiment. Temporary stability does not remove overall market risks.
Q: How do coins like XRP, Dogecoin, Ethereum, Solana, Shiba Inu, and Litecoin fit into volatility trends?
A: These coins are characterized by sharp and frequent price shifts. Their high liquidity and active investor interest contribute to ongoing volatility and attract traders seeking rapid market changes.