
Have you ever wondered if that flashy NFT price shows more than just a number? Price analysis digs deeper into those figures to reveal what digital collectors really feel. By checking key markers like the floor price, the lowest available cost, you can spot trends that hint whether a token is a hidden gem or just overpriced.
This post explains how these market signals shape NFT values. Understanding these changes can help you decide when to hold on or jump in, making your moves with digital assets a whole lot smarter.
nft price analysis: Dynamic Market Trends
NFT price analysis is about understanding digital collectible costs by looking at different market signals and data. At its heart, it zeroes in on the floor price. The floor price is the lowest price you can pay to buy one of these special tokens on the secondary market. For example, imagine hearing that "before digital art blew up, some collectors could grab an NFT for just a tiny fraction of a cent, which set the stage for huge value changes." This way of looking at prices helps folks figure out if a token is a bargain or a splurge, and it lays the groundwork for checking a token's rarity and overall market performance.
Floor price is important because it quickly shows how healthy and strong a project is. When the floor price is high, it usually means buyers have confidence, and there's a steady and lively community behind the project. Think about a well-loved NFT collection where the floor price stays steady even if there’s a lot of trading. This steady price can mean that the number of tokens being sold is keeping pace with the demand, which is a good sign for the project’s future.
Most tools for NFT price analysis come with ready-made dashboards that show basic sales activity and floor price changes. These tools give you a quick glimpse, but they often miss deeper details like small shifts in trading volumes or changes in past sales patterns. That’s why it’s a good idea to use several measures when you want to understand the full picture of market trends and digital asset moves.
Historical Trend Insights In NFT Price Analysis
Looking at past price changes is key to understanding how NFT values have moved over time. It’s like taking a snapshot of history so that both traders and collectors can spot trends, whether it’s a sudden surge in demand or a slowdown. By digging into old sales records and trading volumes, you can better grasp how the market behaves and where opportunities might pop up.
We usually get this historical data from NFT marketplaces and blockchain records. Simply put, blockchain [a digital ledger that tracks every transaction] keeps a detailed log of all NFT trades. This information paints a clear picture of how prices reacted at different times, giving you a solid foundation to base your decisions on.
Sometimes, things get a bit tricky. When JavaScript is disabled, you might miss out on the interactive charts that show these price movements. While pre-built dashboards can give you basic info on past sales and trading volumes, they often lack deeper insights into the on-chain trends. This can leave you wondering about the full story behind the numbers.
The best way to review historical NFT price data is to use a range of sources. Cross-check numbers with blockchain records and use custom tools for more detailed on-chain info. Regularly reviewing past trends can really help you understand the overall market behavior, making it easier to spot where things are headed next.
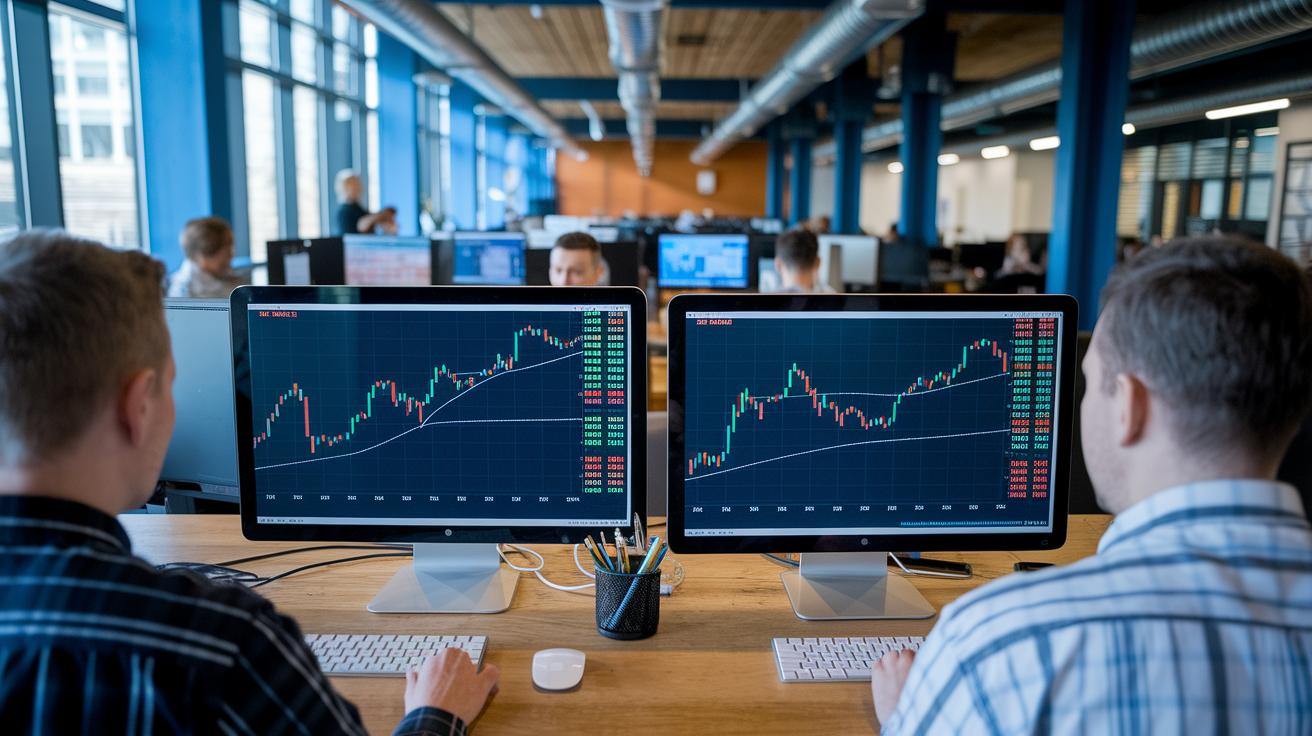
Comparative Review Of NFT Price Analysis Tools
Pre-built NFT analytics dashboards are a popular go-to for checking out NFT price trends. These tools pull in real-time data from various marketplaces, giving you a quick look at volume, past sales, and current prices. Imagine a dashboard that lights up with a sudden surge in a token’s sales, a fast and easy way to feel the market’s vibe.
But these ready-made dashboards only scratch the surface. They mostly focus on the basics, like the lowest asking price and the number of sales, which means they often miss the deeper on-chain activity. So, small but important changes in trading volumes or shifts in transaction patterns can slip by unnoticed.
Custom NFT floor trackers take things a step further. By digging right into on-chain transaction records, they let you filter and examine every trade. This gives you a richer picture of how digital assets are priced and how tokens move in the market, like switching from a quick snapshot to a full, detailed analysis.
When deciding between tools, think about what matters most for you, ease of use or deep analytical detail. Using a mix of both a simple dashboard and a custom tracker can give you a complete view of the market. This balanced method helps you make smart decisions by combining a broad look at the marketplace with specific, detailed trade data.
Key Metrics And Technical Approaches For NFT Price Analysis
When you’re checking out NFT prices, it’s smart to look beyond just the floor price. Instead, consider a mix of signals that gives you a clearer view of the market. For example, trading volume and past sale data offer clues about buyer behavior and overall demand. Custom trackers that use on-chain data can give you more insight than pre-built dashboards, allowing you to spot trends in digital art, gauge demand, and assess liquidity all at once. This method not only shows you the current price but also hints at what might happen next.
- Floor price
- Trading volume
- Historical sales count
- Rarity score
- Ownership distribution
- Average sale price
- On-chain transaction count
Each of these factors adds a unique piece to the puzzle. The floor price serves as the basic starting point, while trading volume shows how busy the market is. Looking at historical sales helps you see past trends. Meanwhile, rarity scores and ownership details can tell you what collectors really value. The average sale price gives you an idea of typical trading levels, and counting on-chain transactions ensures you capture every market move.
By combining these different metrics, you get a well-rounded view of an NFT’s performance. This approach mixes real-time data with historical trends, making it easier for you to judge an asset’s worth and make smarter trading choices.
Case Study In NFT Price Analysis: APENFT Forecast And Historical Data
APENFT is a really good example of how NFT prices can tell us about market trends. Right now, its price sits at $0.000000431127, with a market cap of $431,123,000 and a circulating supply of 999,990,000,000,000. These details give us a clear picture of how digital asset prices can shift over time. Its ranking at number 123, along with a previous market cap of $403,504,000, shows that even small changes in token numbers can affect overall market vibes.
| Year | Min Price | Avg Price | Max Price |
|---|---|---|---|
| 2025 | $0.00000050 | $0.00000052 | $0.00000054 |
| 2026 | $0.00000075 | $0.00000077 | $0.00000088 |
| 2027 | $0.000001 | $0.000001 | $0.000001 |
| 2028 | $0.000002 | $0.000002 | $0.000002 |
| 2029 | $0.000002 | $0.000002 | $0.000003 |
| 2030 | $0.000004 | $0.000004 | $0.000004 |
The forecast shows slow but steady increases with small bumps along the way. Even tiny changes in price can hint at shifts in how traders feel about the market. Experts point out that while the upward trend is promising, the digital asset world is always a bit unpredictable, so it’s smart to stay cautious. In short, mixing historical data with other key market signals is the best way to get a clear view of what might happen next.
Forecasting Approaches In NFT Price Analysis
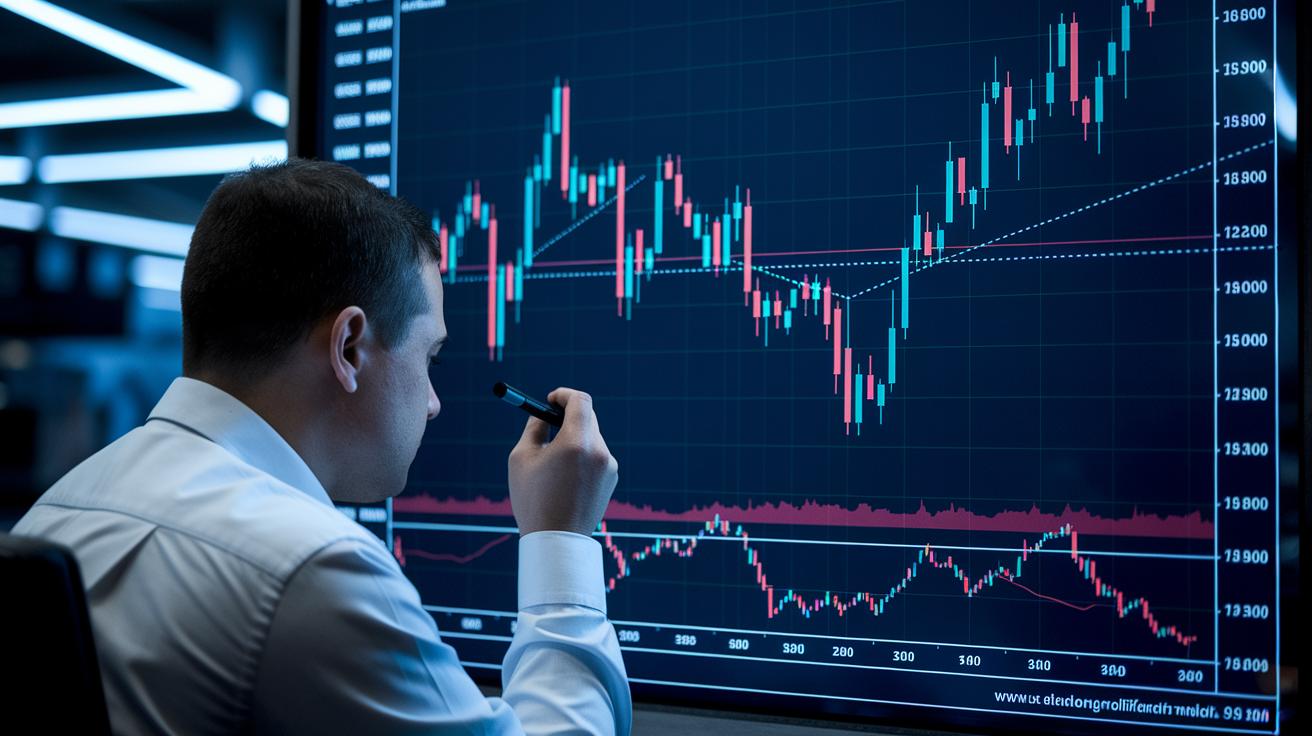
Forecasting NFT prices is about trying to guess where trends are headed using current data and past market behavior. Experts mix different methods, looking at charts, price actions, and trading volumes to spot patterns that might point to future shifts.
Technical analysis comes into play here. It uses tools like moving averages, which smooth out price changes, and support and resistance levels that hint at when prices might bounce back or drop. These approaches help experts see the momentum behind price movements by comparing today’s trends with similar situations in the past.
Some forecasters also lean on statistical techniques and machine learning, that is, smart computer programs that crunch huge amounts of historical data, to find subtle links between various market signals. This blend of computer-driven analysis and classic chart reading can sometimes offer a clearer picture of what might happen next.
With the market being full of surprises and sudden shifts, every forecast is just one piece of the puzzle. It’s important for investors to keep an eye on updates from sources like nft market forecast 2024 and do their own research before making decisions.
NFT Market Sentiment And Risk Assessment In Price Analysis
Market sentiment is a big deal when you’re trying to figure out how an NFT might do. The floor price gives you a quick peek at the market’s confidence, but it doesn’t tell you the full story. Often, the chatter among buyers and sellers offers clues about an NFT’s strength or even hints at possible drops. When folks start talking about a token’s rarity or the buzz around trades slows down, that vibe can help you guess what might happen next.
Risk assessment models work like a flashlight, shining a light on whether price moves are part of a growing bubble or a steady climb. In plain terms, these models look at things like trading volume and past sales to see if all the excitement is backed up by real market activity. Some experts even use extra checks for bubbles, watching for signs that the high hopes might be pushing the price too far beyond what the asset is truly worth. For a closer look at common risk drivers, you can check out examples of market factors.
By mixing in the mood of the market with solid numbers, you get a more balanced view. This kind of approach brings together the emotional side of trading with hard facts like historical sales and trading volume, giving you a better picture of the market’s condition. And when trends shift all of a sudden, that combined insight can really help you make smarter decisions.
Final Words
In the action, we covered NFT price analysis from defining floor price to exploring historical trends. We looked at pre-built dashboards versus custom trackers and broke down key metrics for a well-rounded view. Our discussion also touched on forecasting methods and risk assessment to help clarify today’s volatile market. By staying on top of nft price analysis, smart investors can build a balanced strategy and move forward with confidence.
FAQ
What details do NFT price charts and analyses reveal?
NFT price charts and analyses reveal current floor price, trading volume, historical trends, and overall market direction, giving investors a clear snapshot of digital asset performance over time.
What does NFT price history show?
NFT price history shows past price movements and volatility for digital assets, helping investors spot market trends and weigh potential risks when evaluating NFT investments.
What insights do NFT price analysis PDFs provide?
NFT price analysis PDFs compile detailed market data, historical trends, and key valuation metrics, offering a comprehensive reference for investors to evaluate digital collectibles.
How do NFT price analyses for 2022 and 2025 assist investors?
NFT price analyses for 2022 and 2025 offer historical data and forward-looking projections, helping investors understand past performance and potential future market shifts in the NFT space.
What factors can lead to an NFT price crash?
An NFT price crash may occur due to reduced trading volume, shifting market sentiment, or overvaluation, which can prompt rapid declines in digital asset values and investor confidence.
Are NFTs increasing in value over time?
NFTs can increase in value when demand rises and digital projects succeed, though price movements vary based on market sentiment, project reputation, and overall digital asset trends.
How much is a $1.00 NFT worth in dollars?
A $1.00 NFT holds a baseline value of one dollar, though its market worth can fluctuate according to trading activity, rarity, and the dynamics of the digital asset market.
Is an NFT considered worthless in the current market?
An NFT’s worth depends on demand, rarity, and project reputation; while some tokens may lose value, others remain valuable to collectors based on market performance and digital asset trends.
Will NFTs remain relevant in 2025?
NFTs are expected to stay relevant in 2025 as collectors and investors continue to show interest, with evolving digital platforms and market trends maintaining the appeal of these assets.

