
Ever thought about whether NFT success is just pure luck or if it comes from smart analysis?
When you check out wallet spread, first-time buyers, private sales, and network clusters, you begin to see patterns that matter.
Even a tiny detail in one of these areas can signal a big shift in market momentum.
This straightforward approach turns everyday data into easy clues, helping collectors and creators make savvy moves in the digital asset world.
Practical NFT Analytics Frameworks: Boosting NFT Success
Looking at how many wallets hold a token is a must in practical NFT analysis. It shows you if ownership is spread out across many people or if a few big wallets hold most of the tokens. For example, with CryptoPunks, more than 70% of tokens are held in wallets that own just one token, hinting at a broad mix of collectors.
Tracking first-time buyers is another smart step. This measure tells us how many new wallets are jumping into the project, much like watching first-time home buyers in real estate. Imagine the buzz at a local art show, this number can reveal whether fresh collectors are excited by a new release or if interest might be slowing down.
OTC (over-the-counter) activity also plays a key role. It shows private, pre-arranged sales where serious collectors agree on a deal outside of the public market. Think of it as a seasoned collector quietly buying a rare token without making a big splash. This kind of activity adds another layer to our understanding of market trends.
Network analysis rounds out the picture. By grouping wallets based on their trade values and activity, you can spot clusters of active community members. For instance, a tight cluster with frequent, high-value transactions might point to a dedicated group of collectors fueling the market's spark.
Together, these insights build a practical framework for NFT analytics. They offer a well-rounded view, from ownership distribution to active community engagement, that can really boost NFT success in today's fast-moving digital landscape.
Building Practical NFT Analytics Frameworks with Blockchain Analytics Toolkits

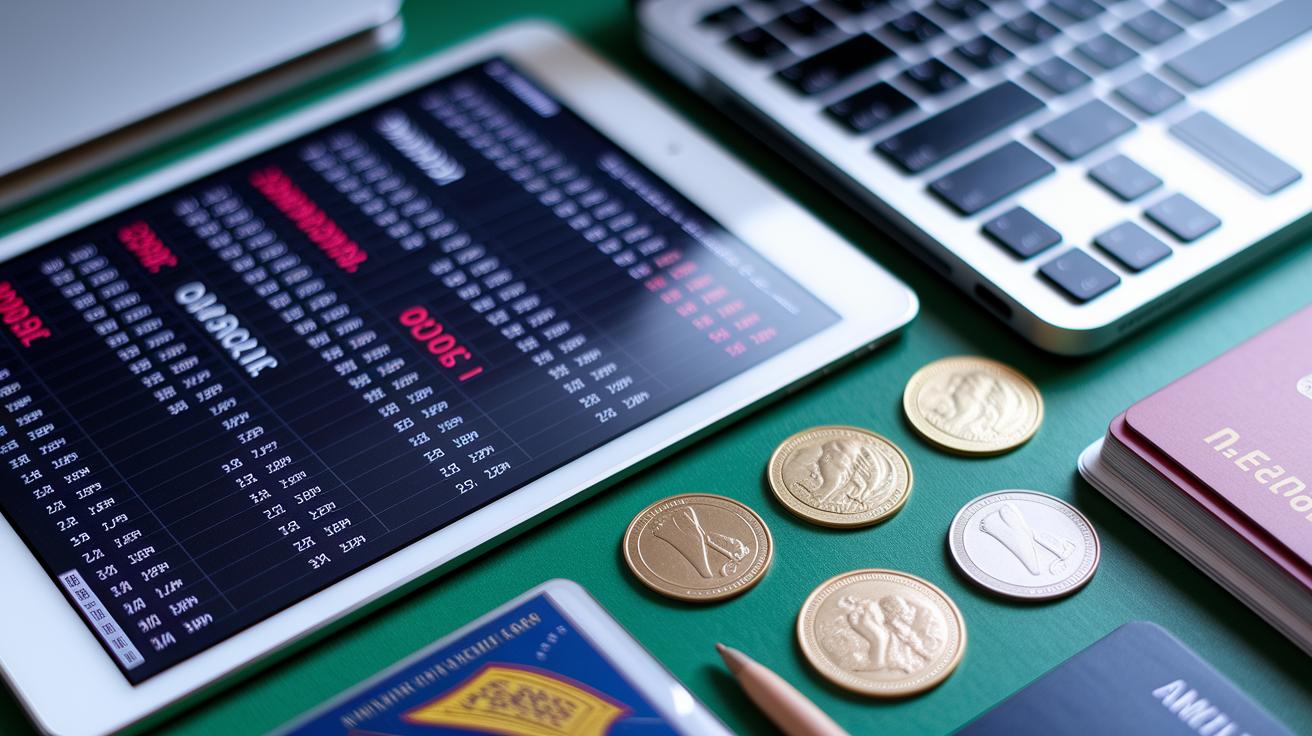
Blockchain analytics toolkits are a big help when you need to understand the NFT market. Tools like Dune Analytics, Nansen, and Tensor let you create custom dashboards to follow transfers, wallet moves, rarity trends, and liquidity changes. And Defy Trends brings millions of on-chain and off-chain data points together in one view, almost like having your own Bloomberg terminal. This live on-chain view helps you spot market shifts as they occur, which is pretty handy for both small collectors and bigger investors.
Big NFT platforms trust secure data pipelines provided by tools like Google BigTable and Adaptive Insights. These systems handle tokenized assets while keeping everyone’s rights protected. They mix data-driven token checks with real-time charts, automated reports, and alert systems to make trend spotting easier. You get clear, easy-to-read reports that point out any major changes without missing a detail.
Using these analytics toolkits makes detailed asset tracking on blockchain simple and clear. This data-focused approach turns complex market info into something easy to follow. With real-time visuals and personalized dashboards, investors can track trends, set alerts, and monitor performance all in one place. It’s like having a set of powerful tools that can really boost your success with NFTs.
These toolkits are more than just asset monitors; they help guide your investment decisions live as markets change. They give you a clear view of how things are moving so you can adjust your strategy on the fly. Isn't it great to have such a smart, easy-to-use tool at your fingertips?
Implementing Data-Driven Token Examinations in Practical NFT Analytics Frameworks
Start by gathering on-chain data. You can use simple tools like Etherscan or The Graph, or even pull data directly from nodes. This first step gives you the raw numbers you need to begin your token analysis.
Next, tidy up your data. Match each transaction with the right USD or ETH rate, remove duplicate entries, and clean up extra details. It’s a bit like tidying a messy closet, when everything is organized, spotting trends becomes a lot easier.
Then, group your data using network clustering techniques. Try algorithms such as Louvain or Girvan-Newman to cluster wallets based on their activity and how much value they move. This method helps you find clusters of active collectors and understand token circulation.
Finally, turn your cleaned-up data into clear visuals. Build dashboards that compare different collections, track key performance numbers, and set alerts for unusual changes. These dashboards transform complex numbers into easy-to-read maps that help you keep an eye on market trends in real time.
By following these steps, data collection, cleaning, grouping, and visualization, you build a strong framework for token analysis. This process turns raw on-chain data into practical insights you can actually use.
Token Valuation Techniques for Practical NFT Analytics Frameworks
Floor-price models kick off our way of looking at digital collectibles. This approach sets a starting point by using the lowest listed or sold price, kind of like comparing prices at different shops. It really works well when you check similar collections, which helps sharpen the accuracy of your valuation. For instance, imagine checking the lowest price of a token that's like one in your collection. In some top collections, that first low sale can even start a trend, much like a gold coin’s debut sale hints at its future value. You can learn more about NFT floor prices here: https://nftworthit.com?p=275.
Then there are rarity-score algorithms. These sort tokens by how rare their special traits are and by looking at past sales data, similar to how you’d sort collectible cards by how hard they are to find. And when you mix in distribution-based benchmarks, you’re comparing things like a project's spread of holders and median sale price against well-known blue-chip collections. This helps you figure out if a collection is popular among a wide range of buyers or if it’s mostly in the hands of a few big collectors.
Lastly, predictive regression adds another layer by using trends in sales volume and average prices over time. Think of it as checking the weather forecast to see what might happen next. When you put all these methods together, you get a solid framework that makes it easier to understand market values and spot new trends in the world of digital collectibles.
Monitoring Market Trends and Performance Metrics in Practical NFT Analytics Frameworks
Keeping an eye on daily and weekly trading volumes gives you a quick peek at what’s going on in the market. Tracking how many tokens change hands over these periods helps you notice shifts that could nudge prices up or down. The average sale price and how much prices jump around are handy clues about market stability. When those numbers stay steady, it hints that things are balanced, but big swings might mean the market is a bit more unpredictable.
We also use something called the liquidity ratio, which you get by dividing the trading volume by the floor price. This simple measure shows how easy it is to buy or sell tokens. A high ratio suggests a lively market with smooth trading, while a lower ratio might signal that buyers or sellers are holding back.
On top of that, factors like positive social media buzz and a rise in off-market trades can act as early warnings of new trends. For instance, if you see a lot of upbeat chatter online or a sudden jump in trades happening off the main market, it might be time to pay closer attention. With all these metrics grouped together on a live NFT analytics dashboard, investors can spot new patterns early and make more informed choices for their digital collectible portfolios.
This clear snapshot of token performance helps break down trends and assess liquidity in NFT and blockchain markets, making it easier to navigate these dynamic investing spaces.
Integrating Investment Analysis into Practical NFT Analytics Frameworks
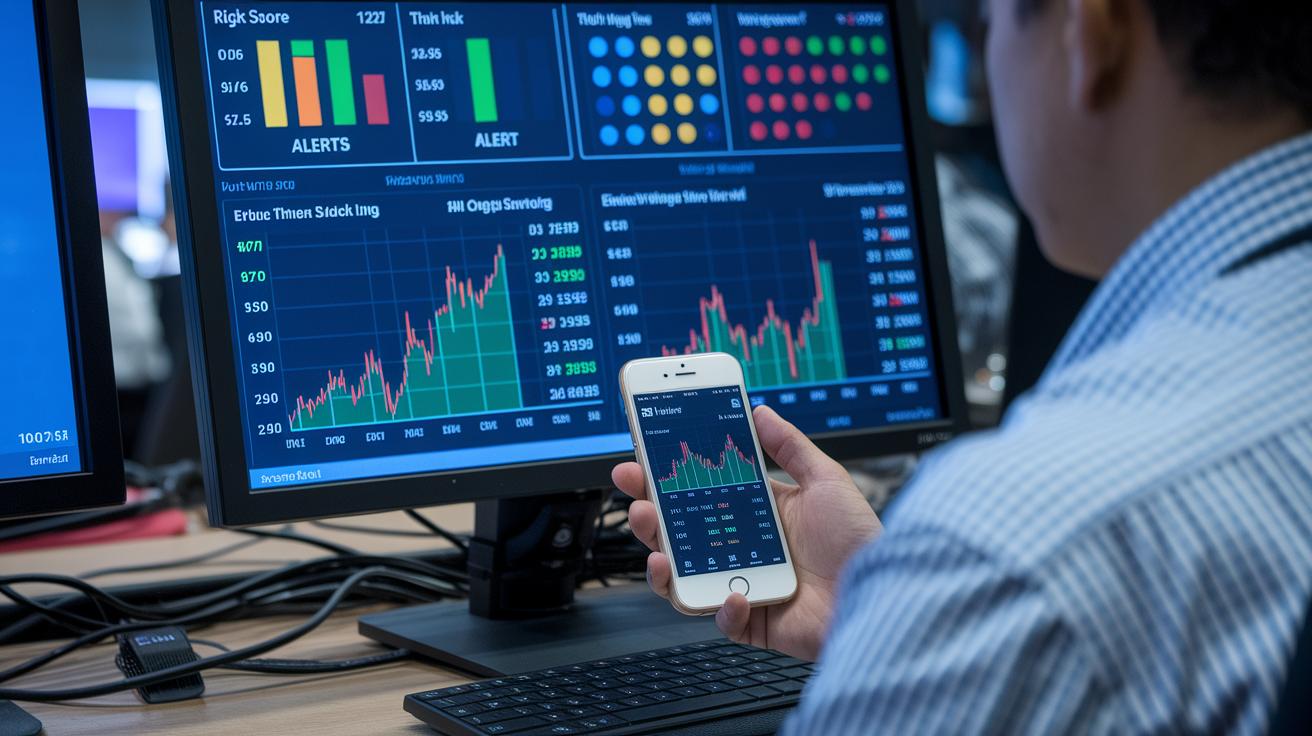
We mix on-chain numbers with rarity and mood data to give each NFT group a solid risk score. For instance, if a token suddenly loses unique holders while its price jumps around, that's a signal to take a closer look. Automated alerts help you catch these shifts right away, just like a dashboard lighting up when your favorite team scores, you know it's time to pay attention.
Putting these insights into your portfolio tracker connects market moves directly to your investment choices. Traders can see how they're doing and adjust their holdings using live on-chain charts. Smart analytics tell you when familiar market patterns show up again, so you can test your ideas against past trends. For example, set an alert for a 10% drop in holders, and if it happens, check your portfolio, much like glancing at your car's gas gauge before you run low. In short, this approach builds a clear, overall view that helps lower risk and boosts your confidence in the crypto market. Testing these signals over time makes your investment rules even stronger, giving you a solid system to manage your NFT assets.
Final Words
In the action, we covered core metrics like unique holders, first-time buyer trends, OTC transactions, and network analysis that form the backbone of practical nft analytics frameworks. We also explored cutting-edge blockchain toolkits and token examination steps to help build reliable dashboards. Each element, from data collection to market trend tracking, plays a role in uncovering actionable insights for digital assets. Keep applying these strategies to diversify your portfolio, manage risk, and seize opportunities in the dynamic world of NFTs.
FAQ
Best practical NFT analytics frameworks
The best practical NFT analytics frameworks incorporate metrics like unique holders, first-time buyers, OTC transactions, and network analysis to offer clear, actionable insights for making smart investment choices.
Howrare
The term Howrare refers to a tool that evaluates NFT scarcity by calculating rarity scores, which help collectors make informed decisions when buying or selling digital assets.
Sol NFT checker
The Sol NFT checker assesses digital collectibles on the Solana blockchain by measuring performance metrics, holder distribution, and market trends to help users quickly gauge project value.
Solana NFT rankings
The Solana NFT rankings organize digital collectibles based on criteria like sales volume and popularity, assisting collectors in identifying promising projects through clear analytical data.
What are the practical uses of NFT?
The practical uses of NFTs include proving digital asset ownership, verifying digital art authenticity, and offering access to exclusive communities, making them a modern tool for asset management and trade.
Are NFTs worth anything anymore?
The worth of NFTs depends on market demand, rarity, and utility; many digital collectibles maintain value through exclusive communities and innovative uses that appeal to both collectors and investors.
Which NFT platform is best?
The best NFT platform varies based on individual needs; consider factors like user interface, market reach, and integrated analytics to choose a platform that fits your investment style.
What is the best marketing strategy for NFT?
The best marketing strategy for NFTs blends clear storytelling, targeted social media campaigns, and active community engagement to drive visibility and build trust among potential buyers.

