
Ever wonder if a little math could help boost your crypto gains? Fibonacci retracement is a tool that takes big market moves and turns them into clear zones where prices might change direction. It’s kind of like drawing safety lines along a winding road to spot where things might bounce. In this post, we’re giving you 5 easy tips to use Fibonacci retracement for crypto profits. Stick with us as we break things down step by step so you can make smarter entry and exit decisions in your trades.
Fibonacci Retracement Crypto Explained: Core Concepts and Benefits

Fibonacci retracement is a tool many crypto traders use to see where prices might slow their fall or rise. It’s built on simple math ratios that hint at potential support or resistance levels. When a coin like Bitcoin makes a big move, traders mark a line from a clear high to a clear low (or the other way around) to spot where buyers might jump in.
The idea is simple. Traders apply ratios, 23.6%, 38.2%, 50%, 61.8%, and 78.6%, to the gap between the high and low. The 61.8% level, often called the golden ratio, gets extra attention because it might signal a strong reversal. Think of it like setting up guardrails on a twisty road to steer your trade decisions.
Here's why the tool is handy:
| Benefit | Description |
|---|---|
| Pinpoints Support/Resistance | Highlights where prices could hold or bounce. |
| Guides Entry/Exit | Helps decide when to enter or leave the market. |
| Works Across Timeframes | Useful for short daily or longer weekly charts. |
| Complements Trends | Adds a quantitative layer to trend strategies. |
| Risk Management | Sets clear, rule-based zones to manage trade risk. |
By marking clear entry and exit points, Fibonacci retracement turns complex market moves into bite-sized pieces that traders can act on. It’s like breaking down a giant puzzle into smaller chunks. Little tweaks based on these levels can lead to disciplined trades where you know the potential rewards and risks ahead of time. It’s a practical, systematic way to navigate the ups and downs of crypto markets.
Drawing Fibonacci Retracement Crypto Levels on Charts

Start by spotting clear swing highs and lows on your crypto charts. Look for those sharp peaks and deep dips where the price makes a noticeable turn. These points set the stage for all your retracement lines. For instance, if Bitcoin surges to a high and then falls steadily, that peak and the following low become your key markers. This foundation is vital for setting up trustworthy retracement ratios.
Next, use the Fibonacci drawing tool on a platform like TradingView. Simply select your marked swing points and watch as the tool automatically lays out levels at 23.6%, 38.2%, 50%, 61.8%, and 78.6%. It can help to use daily or weekly charts too, since they smooth out the short-term noise and highlight the broader trend. And it's pretty cool to see how these retracement lines line up with ongoing price movements, it boosts your confidence in the trend analysis.
Finally, confirm that your retracement levels truly match recent price behavior. Double-check your swing high and low points to make sure they’re consistent. Then, compare the drawn lines with areas where prices have previously stalled or reversed. And if the picture feels off, adjust your levels accordingly. These simple tweaks can make your setup more robust and help enhance your profit potential.
Calculating Fibonacci Retracement Crypto Ratios: A Step-by-Step Guide

Getting the math right is super important when you work with Fibonacci retracement levels. When the numbers check out, it gives you a clear idea of where prices might change direction. You simply draw a line from a swing high to a swing low and then add ratios like 23.6%, 38.2%, 50%, 61.8%, and 78.6% as horizontal markers on your chart.
| Retracement Level | Common Use |
|---|---|
| 23.6% | Minor pullbacks in strong trends |
| 38.2% | Shallow corrections, trend continuation |
| 50.0% | Psychological midpoint, neutral zone |
| 61.8% | Golden ratio, high-probability reversal |
| 78.6% | Deep retracements before resume |
Traders often see each level as a clue about what the market might do next. For example, a 23.6% level might hint at a small dip if the strong trend holds. The 38.2% mark usually shows where light corrections happen before the trend moves on. Many also take the 50% mark as a point where traders might hesitate, making it a kind of dead zone. The 61.8% ratio, called the golden ratio, is usually a strong sign that a reversal could be on its way. And finally, the 78.6% level often tells traders that a big pullback is wrapping up, and the trend might start back up soon.
Using these steps, you can set rules to manage risk and better navigate the fast-paced crypto market, even if the price moves in unexpected ways.
Fibonacci Retracement Crypto in Volatile Markets: Assessing Reliability
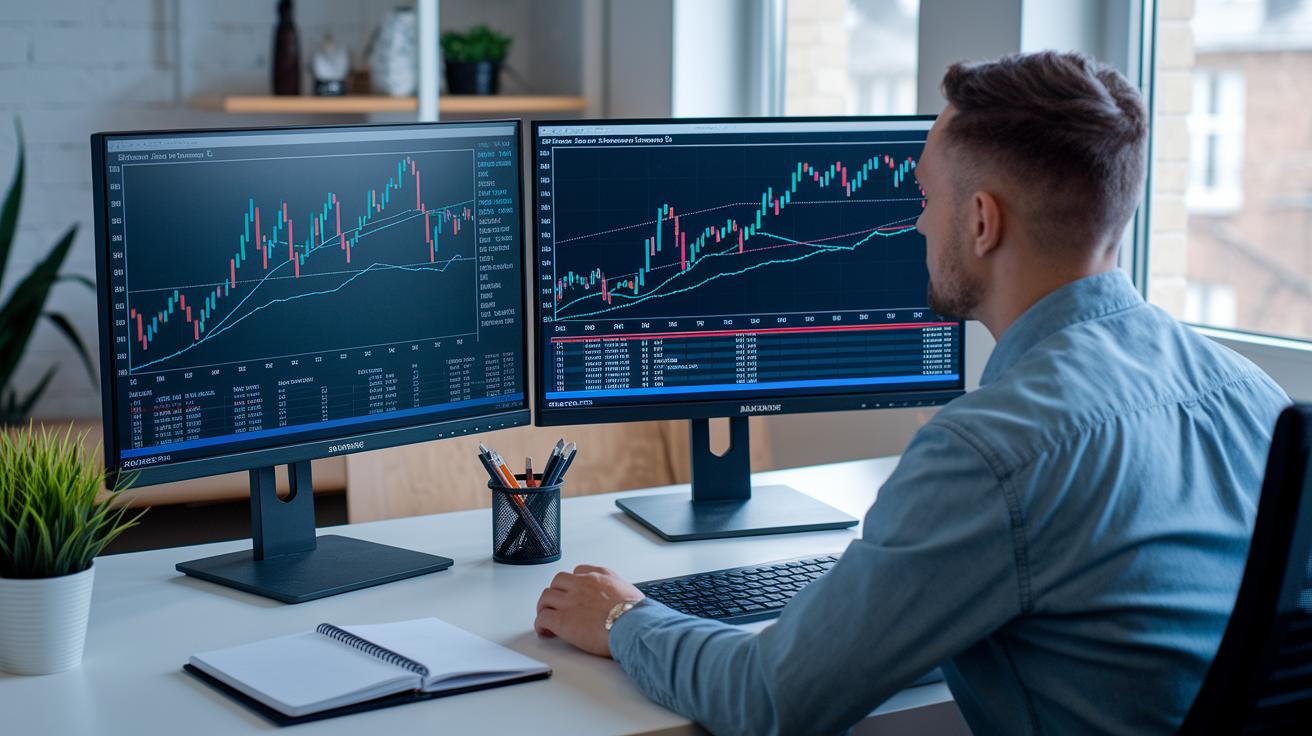
In crypto markets that move so fast, a sudden spike or deep drop can make fib retracement signals appear that don’t really match the overall trend. When prices jump or fall quickly, you might see a false signal that tricks traders into thinking the market has shifted, even if the general mood is still strong.
The skill of using fib retracement depends a lot on the strength of the real trend and the time frame you pick. In choppy markets, short timeframes can add extra noise, making signals less clear. It’s usually better to look at daily or weekly charts that highlight smoother swings and cut through random price blips.
To feel more secure about what the fib levels are saying during wild swings, many traders also mix in other tools like volume or momentum checks. By comparing key levels, say 38.2% or 61.8% pullbacks, with rising trading volume or slight shifts in direction, you get a clearer picture of whether the signal is solid. This mix of checks helps make fib retracement a more dependable guide in a fast-changing market.
Combining Fibonacci Retracement Crypto with Other Technical Indicators

Mixing other chart tools with Fibonacci retracement can really sharpen your signals and help set clear trade limits. Adding extra layers like Simple Moving Averages (SMA) and the Relative Strength Index (RSI), a tool that measures momentum, on top of fib levels lets you spot clues hidden in market noise. These extra checks can tighten your entry and exit points, giving you a more solid basis for making decisions.
Simple Moving Averages
When you line up SMA bands with key retracement points like 38.2% or 61.8%, your analysis gets a boost. Imagine a 20-day SMA meeting a fib level; that meeting reinforces the idea of a potential support or resistance area. For instance, if prices pull back to the 38.2% level while touching an upward-sloping SMA, that overlapping zone hints at a higher chance for a bounce. It’s a clear signal that can help you better understand market sentiment and decide when to jump in.
RSI Confluence
Pairing RSI with fib retracement levels helps you see differences between price moves and market momentum. For example, if the price hits a 61.8% level but the RSI fails to reach a matching high, it suggests that the trend is losing steam and might soon reverse. This confirmation works as part of a broader technical analysis strategy, filtering out false breakouts and strengthening your overall trading plan.
Using these techniques together creates a robust trade setup. Fib levels, SMA alignments, and RSI signals work in unison to guide stricter entry and exit rules, which in turn can improve your risk control and overall trading success.
Advanced Fibonacci Retracement Crypto Strategies and Extensions
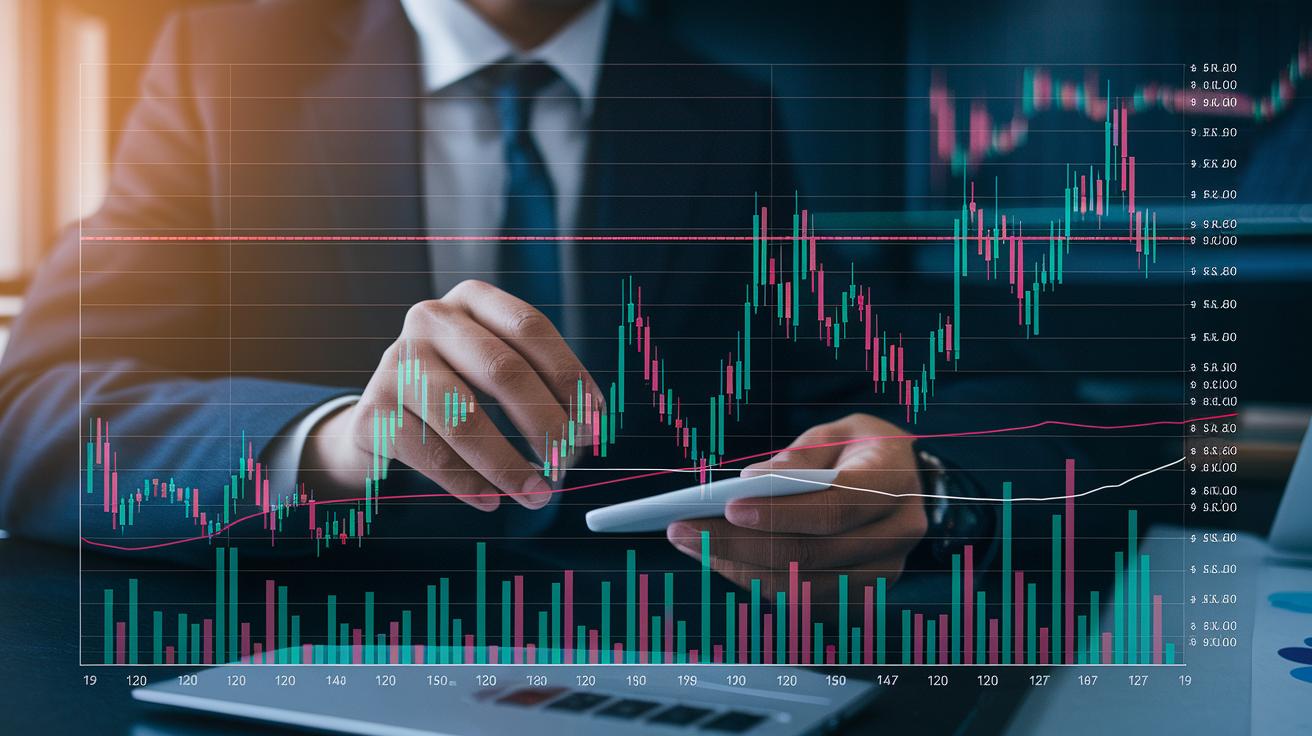
Fibonacci extension levels like 127.2% and 161.8% help point to extra profit spots beyond the usual pullback area. Picture it as a finish line in a race, when your asset, like Bitcoin, moves past the normal levels, these markers hint at where you might catch more gains during a strong trend.
Golden zone clustering focuses on the 50% to 61.8% range, which can help narrow down your entry window. By zeroing in on this tight zone, you boost your chances of catching a solid bounce in price action. For instance, if a coin pulls back and finds support within this range, it often sets up a strong point to jump in.
Altcoins often show swing patterns that can be quite different from the major tokens. It helps to adjust your Fibonacci retracement technique by looking at each asset’s own volatility. This means you might need to tweak where you mark your swing highs and lows so you can better capture the natural moves of these coins.
In fast-moving markets, if the usual retracement levels don’t hold, tightening your risk management becomes really important. Switching to tighter stop-loss orders and reevaluating if those levels still work can safeguard your position. You can add these tips to your bigger plan by exploring crypto trading strategies and fine-tuning your overall approach.
Final Words
In the action, this article broke down how key ratios and clear charting techniques support digital asset trading. It shared steps to draw retracement lines and calculate levels, while explaining how to blend these insights with other market tools.
We looked at practical strategies that help shape entry and exit points in volatile markets. With these ideas in your toolkit, embracing the power of fibonacci retracement crypto can boost your confidence and bring smart, measured moves to your digital investment strategy.
FAQ
What are Fibonacci retracement levels in crypto trading?
Fibonacci retracement levels in crypto trading indicate potential support and resistance zones by using mathematical ratios based on market swings, helping traders spot reversal points.
How does a Crypto Fibonacci Calculator help traders?
A Crypto Fibonacci Calculator quickly computes key retracement levels on charts, aiding traders in identifying potential areas for entry and exit to refine their trading decisions.
How does the Fibonacci crypto trading strategy work?
The Fibonacci crypto trading strategy uses specific ratios from price swings to signal possible market reversals, helping traders plan entries and exits more effectively during fluctuating trends.
What do Bitcoin Fibonacci levels today and for 2025 indicate?
Bitcoin Fibonacci levels, whether observed today or projected for 2025, reveal potential support and resistance areas that can guide traders by highlighting key price points on the chart.
Can Fibonacci retracement be effective for intraday trading?
The intraday Fibonacci retracement strategy focuses on identifying short-term reversal zones within daily market swings, offering timely signals that help traders adjust positions quickly.
What are the roles of the Fibonacci retracement tool and Fibonacci Crypto app?
The Fibonacci retracement tool and Crypto app enable traders to draw and track retracement levels visually on charts, making it easier to analyze markets and set up risk-based trading plans.
What is the Fibonacci rule and best settings in crypto trading?
The Fibonacci rule in crypto relies on ratios like 23.6%, 38.2%, 50%, and 61.8% to set retracement levels; these settings form a common baseline for managing risk and chart analysis.
Why is 0.618 important in crypto trading?
The 0.618 level represents the golden ratio in crypto trading, often marking a high-probability reversal area, which boosts confidence when making trade decisions in volatile markets.