
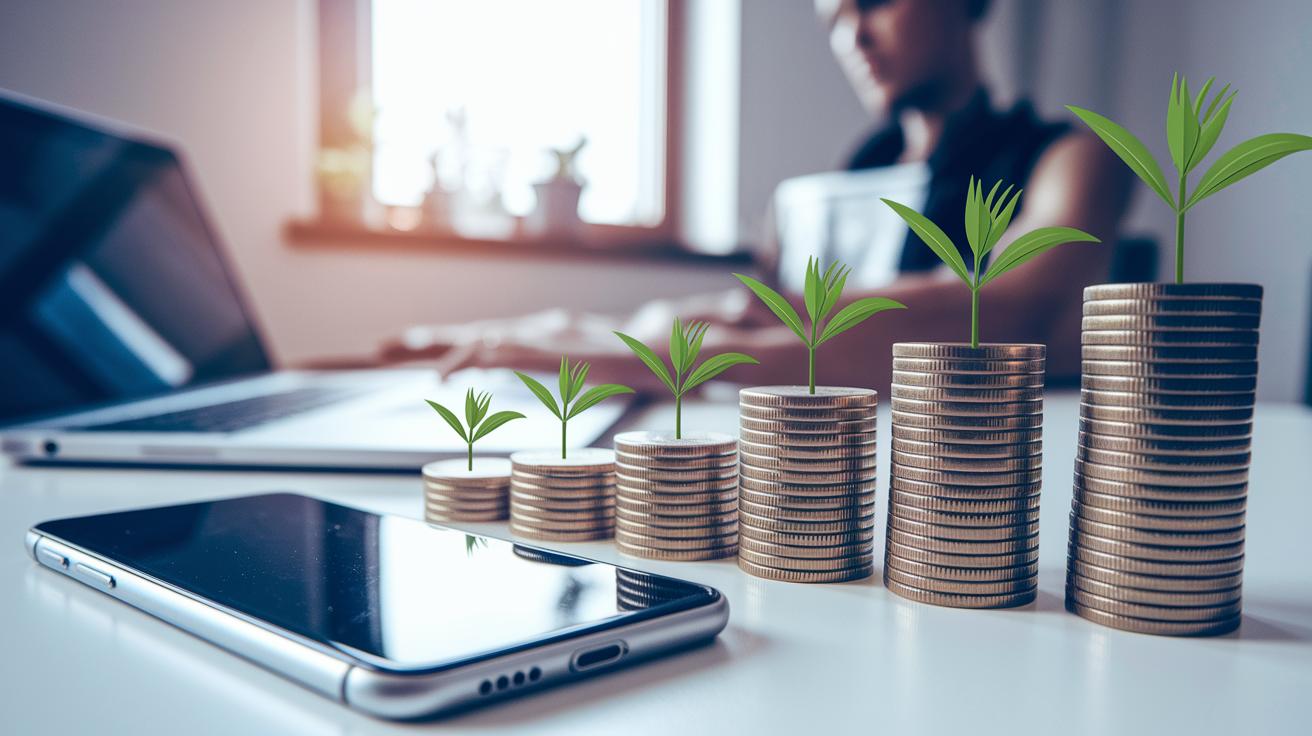
Have you ever noticed how NFT prices sometimes jump wildly and other times settle into a steady climb? It can feel like one day they’re reaching exciting highs and the next they're taking it slow. More folks are now joining the scene, and smart changes in how NFTs are traded hint at a future where these digital assets become a more dependable investment. In this article, I'll walk you through what these trends mean and how NFT growth is really taking shape.
Essential Insights from NFT Market Analysis

The NFT market has seen plenty of ups and downs over the past few years. Last year, revenue hit a high of $1.58 billion in 2022, then settled down to around $600–700 million by 2024–2025. The overall market value also had its moments, soaring above $340 billion in 2022 before dropping to roughly $10–15 billion by mid-2025, according to NFTWorthIt's trends.
User numbers tell a similar story. In 2020, less than 1 million people were involved, but by 2025 that number jumped to over 11 million, with expectations of reaching 16 million by 2028. This growth has helped create a steadier group of collectors, even though the market still experiences quick price spikes and falls.
Looking at trading volumes, profile picture NFTs make up about 37% of the activity, while gaming-related NFTs account for 25% of all trades. Annual sales volumes also show clear trends: they reached $27.8 billion in 2021, dropped to $21.4 billion in 2022, and fell further to $11.7 billion in 2023. These figures highlight both the market’s wild swings and the consistent interest in certain types of digital assets.
It’s a dynamic market where bursts of growth are balanced by needed corrections, all driven by tech advances and changing collector habits. Have you ever noticed how a small shift can change everything? This mix of high energy and occasional pullbacks makes the NFT market both exciting and a bit hard to predict.
Historical Valuation Trends in NFT Market Analysis

When you look at NFT numbers, you can really see how investor moods and market forces mix together. In 2021, a burst of retail excitement and tech upgrades pushed revenues past $1 billion and market cap over $100 billion. Then in 2022, investor cheer and media buzz took things to a new high. Since 2023, the numbers have steadied, hinting that tighter rules and a more cautious investor approach are shifting the focus to long-term health.
For a fun fact, check this out: Before digital assets became the buzz, sharp investors noticed how quickly NFT values shot up, turning a small market into a major contender almost overnight.
| Year | Annual Revenue (USD) | Market Cap (USD) | Market Implications |
|---|---|---|---|
| 2020 | <$10 M | , | Low investor interest; early stage |
| 2021 | >$1 B | >$100 B | Surge driven by retail buzz and tech advances |
| 2022 | $1.58 B | $340 B | Peak fueled by market hype and risk-taking |
| 2023 | $600–700 M | $10–15 B | Steady figures reflecting regulatory effects and maturing trends |
| 2024 | $600–700 M | $10–15 B | Continuing stability and measured growth |
| 2025(est.) | $600–700 M | $10–15 B | Institutional interest and a focus on sustainability |
NFT Trading Volume Dynamics and Market Segmentation Analysis
In 2021, NFT trading hit a high of $27.819 billion. Then, by 2022, it dropped to $21.445 billion and fell further to $11.675 billion in 2023. Picture it like a roller coaster ride, starting with a huge climb, then gradually easing off. It’s a bit like a bustling holiday market that slowly settles down as the day goes on.
Profile picture NFTs led the pack with 37 percent of the activity, while Gaming NFTs made up 25 percent. The rest sprinkled out among categories like Music, Media, and even some real-world assets. This mix shows how different NFT types each play a role in shaping the overall market vibe.
Market trends took off fast in late 2021 and early 2022, but 2023 brought sharper adjustments. It’s a gentle reminder for investors: the digital asset scene can change very quickly. Keeping a balanced view and learning from these twists and turns can really help you navigate the market smarter.
High-Value NFT Sales and Benchmark Analysis
Record-breaking NFT sales are setting new standards in the digital art world. Take “The Merge” by Pak, which went for $91.8 million in December 2021. This sale grabbed everyone's attention and showed just how much people are excited about digital masterpieces. Then there’s Beeple’s “Everydays: The First 5000 Days,” sold for $69.3 million in March 2021, proving that digital collectibles are becoming serious investment options. Another key sale, “Clock” by Pak & Julian Assange, reached $52.7 million, which confirms the strong demand for top-notch digital art.
These standout deals show that bold moves in the NFT market can drive growth over time. They invite investors to explore digital art as a promising new asset class, beyond traditional art. Imagine a sale that shakes market expectations, this is the kind of change that sparks fresh ideas and pushes up premium values. These milestones are not just numbers; they boost confidence and shape how collectors see the NFT space.
NFT Marketplace Rankings and Comparative Analysis
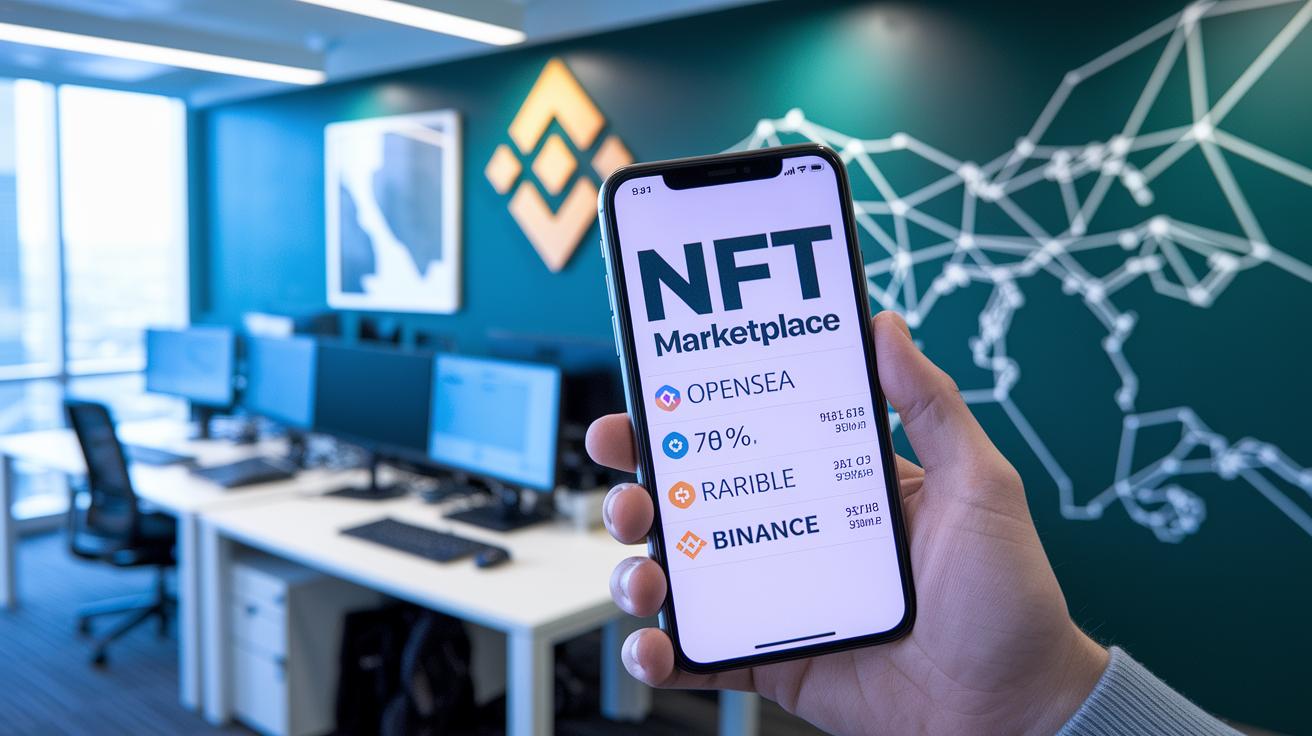
The leading NFT platforms are changing how buyers and sellers trade digital assets. OpenSea stays at the top, handling around 70% of daily trading volume. Investors love its wide range of collections and user-friendly design. Meanwhile, Rarible and Binance fill the rest of the space, each creating a unique niche that appeals to different collectors. If you're curious about how marketplaces compare, you can explore more insights through the link provided.
New blockchain networks like Polygon are shaking things up by powering marketplaces with lower fees. In 2023, Polygon saw a 15% jump in new users looking for cost-effective trading options. These innovations not only add to the trading volume but also mix up the overall market. When choosing a venue for your trades, it’s smart to consider factors like transaction fees and network speeds.
| Platform | Daily Trading Volume Share | Notable Feature |
|---|---|---|
| OpenSea | ~70% | Wide collection variety and ease of use |
| Rarible | Part of balance | Community-focused and flexible governance |
| Binance | Part of balance | Integrated trading and robust liquidity |
| Polygon-powered Marketplaces | Growing share | Low fees and increased transaction speed |
Forecasting Models and Risk Factors in NFT Market Analysis

NFTs are on track to grow by more than 30% a year through 2030, thanks to new uses and more people jumping in. Experts expect the number of users to increase from 11 million in 2025 to 16 million by 2028. This surge makes it key for investors to understand how future price forecasting works so they can follow market trends closely.
Experts use a few different forecasting methods to get a handle on NFT prices. One approach is time-series forecasting, which looks at historical price and trade data to spot trends over time. There are also machine-learning models that use past data to predict short-term shifts in prices, like changes in the floor price. Plus, sentiment-based analysis mixes social media trends with trading info to see how the market feels, almost like noticing a burst of upbeat chatter before a price jump.
But there are some risks that could shake up these positive predictions. For example, high Ethereum gas fees are making it costlier to create new NFTs, and there are ongoing debates about energy use and sustainability. About one-third of people still view NFTs with caution. If you want to learn how to handle these risks, you might want to look into strategies for digital finance risk management.
In short, using a mix of trustworthy forecasting methods with a clear view of potential risks can really help guide investors. It offers a balanced way to get ready for growth and plan smart strategies in the ever-changing world of digital assets.
Tools and Analytics Platforms for Advanced NFT Market Analysis
If you're into NFTs, you know that the right tools and analytics platforms are game changers for both collectors and traders. These platforms offer real-time tracking of the lowest price (the floor price) and easy-to-read charts of past prices, so you can watch market moves without being stuck at your computer. And with mobile support, keeping up with changes is as simple as checking your phone.
Many of these systems now tap into blockchain data (a digital ledger that records transactions) using special APIs. This means you can get quick details like price history and trade volume without any hassle. Plus, data aggregators pull information from several NFT marketplaces, allowing you to sort collections based on market cap, trading volumes, or sales counts over periods like 24 hours, 7 days, or 30 days.
A smart trick many investors use is to multiply the floor price by the total supply to gauge a collection’s market value. This helps compare projects side by side more easily. And if you're still on the lookout for the best analytics software, you might check out some trend analysis tools for traders for extra insights.
In short, this mix of real-time data, comprehensive aggregation, and easy-to-read visual tools sets you up to make informed decisions in a fast-changing NFT market. Isn’t it exciting how technology can guide your next move?
Final Words
In the action, we covered key aspects of nft market analysis that outline the shifts in revenue peaks, market capitalization trends, and trading volume changes. We saw how landmark NFT sales and marketplace rankings shine a light on the true dynamics of digital asset investments. Forecasting models and risk factors were explored, alongside essential analytical tools that offer clarity in volatile conditions. These insights empower you to build a balanced portfolio and make data-driven choices, moving forward with a positive outlook.
FAQ
Q: What does NFT market analysis 2022 indicate?
A: The NFT market analysis 2022 shows that revenue peaked at $1.58 billion and market capitalization hit $340 billion, marking a surge before stabilizing around $600–700 million in revenue with a retracted cap by 2025.
Q: What defines the best NFT market analysis and report?
A: The best NFT market analysis and report combine key data like revenue figures, market cap trends, trading volume dynamics, and user growth, giving investors a clear snapshot of market performance and trends.
Q: What is the current and future NFT market size and value?
A: The NFT market size peaked with a $340 billion cap in 2022 and is forecast to shrink to $10–15 billion by 2025. Projections include a strong yearly growth rate, with a future market size potentially rising significantly by 2030.
Q: What does NFT market data include?
A: The NFT market data covers metrics such as revenue figures, trading volumes, market cap variations, user growth, and the share of different NFT categories, all crucial for understanding overall market performance.
Q: How is the NFT market doing right now?
A: The NFT market is experiencing a correction phase with stabilized revenue and a much lower market cap compared to its peak, reflecting a market that remains active despite recent declines.
Q: What does it mean when some say NFTs are worthless now?
A: The claim that NFTs are worthless now overlooks that NFT value is based on rarity, creator reputation, and buyer interest. While prices have declined from their peaks, many NFTs still hold significant collectible or utility value.
Q: Is there still a future for NFTs?
A: The future for NFTs looks promising, with expanding use cases, growing user communities, and ongoing innovations in trading platforms, suggesting sustained relevance despite market corrections.
Q: How do NFT market crash and collapse compare?
A: The NFT market crash refers to the sharp decline in trading volumes and market cap after rapid growth, not a complete collapse, as the market has since stabilized and remains active.

